Showing posts with label Software. Show all posts

Monday, November 2, 2015

Software from CSHL Genome Informatics 2015

I just returned from the Genome Informatics meeting at Cold Spring Harbor. This was, hands down, the best scientific conference I've been to in years. The quality of the talks and posters was excellent, and it was great meeting in person many of the scientists and developers whose tools and software I use on a daily basis. To get a sense of what the meeting was about, 140 characters at a time, you can access all the Tweets sent Oct 28-31 2015 tagged #gi2015 at this link.

Below is a very short list of software that was presented at GI2015. This is only a tiny slice of the tools and methods that were presented at the meeting, and the list is highly biased toward tools that I personally find interesting or useful to my own work (please don't be offended if I omitted your stuff, and feel free to mention it in the comments).

Monocle: Software for analyzing single-cell RNA-seq data
Paperhttp://www.nature.com/nbt/journal/v32/n4/full/nbt.2859.html
Softwarehttp://cole-trapnell-lab.github.io/monocle-release/

Kallisto: very fast RNA-seq transcript abundance estimation using pseudoalignment.
Preprinthttp://arxiv.org/abs/1505.02710
Softwarehttp://pachterlab.github.io/kallisto/about.html

Sleuth: R package for analyzing & reporting differential expression analysis from transcript abundances estimated with Kallisto.
Preprint: coming soon?
Softwarehttp://pachterlab.github.io/sleuth/about.html
See also: The bear's lair (http://lair.berkeley.edu/): reanalysis of published RNA-seq studies using kallisto+sleuth.

QoRTs: Quality of RNA-Seq Toolset. Toolkit for QC, gene/junction counting, and other miscellaneous downstream processing from RNA-seq alignments.

JunctionSeq: R package for testing differential junction usage with RNA-seq data.

HISAT2: RNA-seq alignment against populations of genomes (aligns DNA also).
Softwarehttp://ccb.jhu.edu/software/hisat2/index.shtml

Rail: software for aligning many-sample RNA-seq data, producing alignments, genome coverage bigWigs, and splice junction BED files.
Softwarehttp://rail.bio
Preprinthttp://biorxiv.org/content/early/2015/08/11/019067

LobSTR: genotype short tandem repeats from NGS data.
Softwarehttp://melissagymrek.com/lobstr-code/
Paperhttp://www.ncbi.nlm.nih.gov/pubmed/22522390

Basset: convolutional neural networks for learning functional/regulatory features of DNA sequence.
Softwarehttps://github.com/davek44/Basset
Preprinthttp://biorxiv.org/content/early/2015/10/05/028399

Genotype Query Tools (GQT): fast/efficient individual-level queries of large-scale variation data.
Softwarehttps://github.com/ryanlayer/gqt
Preprinthttp://biorxiv.org/content/early/2015/06/05/018259

Centrifuge: a metagenomics classifier.
Softwarehttps://github.com/infphilo/centrifuge
Posterhttp://www.ccb.jhu.edu/people/infphilo/data/Centrifuge-poster.pdf

Mash: MinHash-based method for rapidly estimating pairwise distances between genomes or metagenomes.
Softwarehttps://github.com/marbl/Mash
Docshttp://mash.readthedocs.org/en/latest/
Preprinthttp://biorxiv.org/content/early/2015/10/26/029827

VCFanno: ultrafast large-sample VCF annotation
Softwarehttps://github.com/brentp/vcfanno

Ginkgo: Interactive analysis and assessment of single-cell copy-number variations
Paper: http://www.nature.com/nmeth/journal/v12/n11/full/nmeth.3578.html
Software: https://github.com/robertaboukhalil/ginkgo

StringTie: RNA-seq transcript assembly+quantification, with or without a reference. See paper for comparison to existing tools.
Software: http://ccb.jhu.edu/software/stringtie/
Source: https://github.com/gpertea/stringtie
Poster: http://ccb.jhu.edu/software/stringtie/cshl2015.pdf
Paperhttp://www.nature.com/nbt/journal/v33/n3/full/nbt.3122.html


Thursday, May 15, 2014

qqman: an R package for creating Q-Q and manhattan plots from GWAS results

Three years ago I wrote a blog post on how to create manhattan plots in R. After hundreds of comments pointing out bugs and other issues, I've finally cleaned up this code and turned it into an R package.

The qqman R package is on CRAN: http://cran.r-project.org/web/packages/qqman/

The source code is on GitHub: https://github.com/stephenturner/qqman

If you'd like to cite the qqman package (appreciated but not required), please cite this pre-print: Turner, S.D. qqman: an R package for visualizing GWAS results using Q-Q and manhattan plots. biorXiv DOI: 10.1101/005165 (2014).

Something wrong? Please file bug reports, feature requests, or anything else related to the code as an issue on GitHub rather than commenting here. Also, please post the code you're using and some example data causing a failure in a publicly accessible place, such as a GitHub gist (no registration required). It's difficult to troubleshoot if I can't see the data where the code is failing. Want to contribute? Awesome! Send me a pull request.

Note: This release is substantially simplified for the sake of maintainability and creating an R package. The old code that allows confidence intervals on the Q-Q plot and allows more flexible annotation and highlighting is still available at the version 0.0.0 release on GitHub.

Here's a shout-out to all the blog commenters on the previous post for pointing out bugs and other issues, and a special thanks to Dan Capurso and Tim Knutsen for useful contributions and bugfixes.


qqman package tutorial

First things first. Install the package (do this only once), then load the package (every time you start a new R session)
# only once:
install.packages("qqman")

# each time:
library(qqman)
You can access this help any time from within R by accessing the vignette:
vignette("qqman")
The qqman package includes functions for creating manhattan plots and q-q plots from GWAS results. The gwasResults data.frame included with the package has simulated results for 16,470 SNPs on 22 chromosomes. Take a look at the data:
str(gwasResults)
'data.frame':   16470 obs. of  4 variables:
 $ SNP: chr  "rs1" "rs2" "rs3" "rs4" ...
 $ CHR: int  1 1 1 1 1 1 1 1 1 1 ...
 $ BP : int  1 2 3 4 5 6 7 8 9 10 ...
 $ P  : num  0.915 0.937 0.286 0.83 0.642 ...
head(gwasResults)
  SNP CHR BP      P
1 rs1   1  1 0.9148
2 rs2   1  2 0.9371
3 rs3   1  3 0.2861
4 rs4   1  4 0.8304
5 rs5   1  5 0.6417
6 rs6   1  6 0.5191
tail(gwasResults)
          SNP CHR  BP      P
16465 rs16465  22 530 0.5644
16466 rs16466  22 531 0.1383
16467 rs16467  22 532 0.3937
16468 rs16468  22 533 0.1779
16469 rs16469  22 534 0.2393
16470 rs16470  22 535 0.2630
How many SNPs on each chromosome?
as.data.frame(table(gwasResults$CHR))
   Var1 Freq
1     1 1500
2     2 1191
3     3 1040
4     4  945
5     5  877
6     6  825
7     7  784
8     8  750
9     9  721
10   10  696
11   11  674
12   12  655
13   13  638
14   14  622
15   15  608
16   16  595
17   17  583
18   18  572
19   19  562
20   20  553
21   21  544
22   22  535

Creating manhattan plots

Now, let's make a basic manhattan plot.
manhattan(gwasResults)

We can also pass in other graphical parameters. Let's add a title (main=), reduce the point size to 50%(cex=), and reduce the font size of the axis labels to 80% (cex.axis=):
manhattan(gwasResults, main = "Manhattan Plot", cex = 0.5, cex.axis = 0.8)

Let's change the colors and increase the maximum y-axis:
manhattan(gwasResults, col = c("blue4", "orange3"), ymax = 12)

Let's remove the suggestive and genome-wide significance lines:
manhattan(gwasResults, suggestiveline = F, genomewideline = F)

Let's look at a single chromosome:
manhattan(subset(gwasResults, CHR == 1))

Let's highlight some SNPs of interest on chromosome 3. The 100 SNPs we're highlighting here are in a character vector called snpsOfInterest. You'll get a warning if you try to highlight SNPs that don't exist.
str(snpsOfInterest)
 chr [1:100] "rs3001" "rs3002" "rs3003" "rs3004" "rs3005" ...
manhattan(gwasResults, highlight = snpsOfInterest)

We can combine highlighting and limiting to a single chromosome:
manhattan(subset(gwasResults, CHR == 3), highlight = snpsOfInterest, main = "Chr 3")

A few notes on creating manhattan plots:
  • Run str(gwasResults). Notice that the gwasResults data.frame has SNP, chromosome, position, and p-value columns named SNP, CHR, BP, and P. If you're creating a manhattan plot and your column names are different, you'll have to pass the column names to the chr=, bp=, p=, and snp= arguments. See help(manhattan) for details.
  • The chromosome column must be numeric. If you have “X,” “Y,” or “MT” chromosomes, you'll need to rename these 23, 24, 25, etc.
  • If you'd like to change the color of the highlight or the suggestive/genomewide lines, you'll need to modify the source code. Search for col="blue", col="red", or col="green3" to modify the suggestive line, genomewide line, and highlight colors, respectively.

Creating Q-Q plots

Creating Q-Q plots is straightforward - simply supply a vector of p-values to the qq() function. You can optionally provide a title.
qq(gwasResults$P, main = "Q-Q plot of GWAS p-values")


Wednesday, December 18, 2013

Curoverse raises $1.5M to develop & support an open-source bioinformatics data analysis platform


Boston-based startup Curoverse has announced $1.5 million in funding to develop and support the open-source Arvados platform for cloud-based bioinformatics & genomics data analysis.

The Arvados platform was developed in George Church's lab by scientists and engineers led by Alexander Wait Zaranek, now scientific director at Curoverse. According to the Arvados wiki:

Arvados is a platform for storing, organizing, processing, and sharing genomic and other biomedical big data. The platform is designed to make it easier for bioinformaticians to develop analyses, developers to create genomic web applications and IT administers to manage large-scale compute and storage genomic resources. The platform is designed to run on top of "cloud operating systems" such as Amazon Web Services and OpenStack. Currently, there are implementations that work on AWS and Xen+Debian/Ubuntu. ... A set of relatively low-level compute and data management functions are consistent across a wide range of analysis pipelines and applications that are being built for genomic data. Unfortunately, every organization working with these data have been forced to build their own custom systems for these low level functions. At the same time, there are proprietary platforms emerging that seek to solve these same problems. Arvados was created to provide a common solution across a wide range of applications that would be free and open source.

A few questions should be apparent: What value does Arvados provide over other more widely used platforms (namely, Galaxy) that also aim to enable reproducibility, transparency, sharing, collaboration, and data/workflow management with biological big data? And how does Curoverse distinguish itself from other cloud-based bioinformatics services like Seven Bridges, DNA Nexus, and the next implement-GATK-on-Amazon-and-sell-it-back-to-me service provider that pops up? I understand that there are real costs with free software, but will the service that Curoverse provides be valuable and cost-effective enough to overcome the activation energy and make up for the "switching costs" that the average bioinformatician faces on adopting a new way of doing things? While the platform and the support model sound potentially very useful, these are all questions that the Curoverse team will need to carefully consider in attracting new users.

Arvados open-source bioinformatics analysis platform: https://arvados.org/

Curoverse: https://curoverse.com/

Press Release: http://www.prweb.com/releases/2013/12/prweb11424292.htm

Wednesday, August 21, 2013

Utility script for launching bare JAR files

Torsten Seemann compiled a list of minimum standards for bioinformatics command line tools, things like printing help when no commands are specified, including version info, avoid hardcoded paths, etc. These should be obvious to any seasoned software engineer, but many of these standards are not followed in bioinformatics.

#8 on the list was "Don't distribute bare JAR files." This is particularly annoying, requiring a user to invoke the software using something like: java -Xmx1000m -jar /path/on/my/system/to/software.jar . There are a few notable offenders in bioinformatics out there (I'm looking at you, Trimmomatic, snpEff, GATK...).

A very simple solution to the bare JAR file problem is distributing your java tool with a shell script wrapper that makes it easier for your users to invoke. E.g., if I have GATK installed in ~/bin/ngs/gatk/GenomeAnalysisTK.jar, I can create this shell script at ~/bin/ngs/gatk/gatk (replace GenomeAnalysisTK.jar with someOtherBioTool.jar):


Once I make that script executable and include that directory in my path, calling GATK is much simpler:


Yes, I'm fully aware that making my own JAR launcher utility scripts for existing software will make my code less reproducible, but for quick testing and development I don't think it matters. The tip has the best results when JAR files are distributed from the developer with utility scripts for invoking them.

See the post below for more standards that should be followed in bioinformatics software development.

Torsten Seeman: Minimum standards for bioinformatics command line tools

Wednesday, July 24, 2013

Archival, Analysis, and Visualization of #ISMBECCB 2013 Tweets

As the 2013 ISMB/ECCB meeting is winding down, I archived and analyzed the 2000+ tweets from the meeting using a set of bash and R scripts I previously blogged about.

The archive of all the tweets tagged #ISMBECCB from July 19-24, 2013 is and will forever remain here on Github. You'll find some R code to parse through this text and run the analyses below in the same repository, explained in more detail in my previous blog post.

Number of tweets by date:


Number of tweets by hour:


Most popular hashtags, other than #ismbeccb. With separate hashtags for each session, this really shows which other SIGs and sessions were well-attended. It also shows the popularity of the unofficial ISMB BINGO card.


Most prolific users. I'm not sure who or what kind of account @sciencstream is - seems like spam to me.


And the obligatory word cloud:


Friday, June 7, 2013

ENCODE ChIP-Seq Significance Tool: Which TFs Regulate my Genes?

I collaborate with several investigators on gene expression projects using both microarray and RNA-seq. After I show a collaborator which genes are dysregulated in a particular condition or tissue, the most common question I get is "what are the transcription factors regulating these genes?"

This isn't the easiest question to answer. You could look at transcription factor binding site position weight matrices like those from TRANSFAC and come up with a list of all factors that potentially hit that site, then perform some kind of enrichment analysis on that. But this involves some programming, and is based solely on sequence motifs, not experimental data.

The ENCODE consortium spent over $100M and generated hundreds of ChIP-seq experiments for different transcription factors and histone modifications across many cell types (if you don't know much about ENCODE, go read the main ENCODE paper, and Sean Eddy's very fair commentary). Regardless of what you might consider "biologically functional", the ENCODE project generated a ton of data, and much of this data is publicly available. But that still doesn't help answer our question, because genes are often bound by multiple TFs, and TFs can bind many regions. We need to perform an enrichment (read: hypergeometric) test to assess an over-representation of experimentally bound transcription factors around our gene targets of interest ("around" also implies that some spatial boundary must be specified). To date, I haven't found a good tool to do this easily.

Raymond Auerbach and Bin Chen in Atul Butte's lab recently developed a resource to address this very common need, called the ENCODE ChIP-Seq Significance Tool.

The paper: Auerbach et al. Relating Genes to Function: Identifying Enriched Transcription Factors using the ENCODE ChIP-Seq Significance Tool. Bioinformatics (2013): 10.1093/bioinformatics/btt316.

The software: ENCODE ChIP-Seq Significance Tool (http://encodeqt.stanford.edu/).

This tool takes a list of "interesting" (significant, dysregulated, etc.) genes as input, and identifies ENCODE transcription factors from this list. Head over to http://encodeqt.stanford.edu/, select the ID type you're using (Ensembl, Symbol, etc), and paste in your list of genes. You can also specify your background set (this has big implications for the significance testing using the hypergeometric distribution). Scroll down some more to tell the tool how far up and downstream you want to look from the transcription start/end site or whole gene, select an ENCODE cell line (or ALL), and hit submit. 

You're then presented with a list of transcription factors that are most likely regulating your input genes (based on overrepresentation of ENCODE ChIP-seq binding sites). Your results can then be saved to CSV or PDF. You can also click on a number in the results table and get a list of genes that are regulated by a particular factor (the numbers do not appear as hyperlinks in my browser, but clicking the number still worked).

At the very bottom of the page, you can load example data that they used in the supplement of their paper, and run through the analysis presented therein. The lead author, Raymond Auerbach, even made a very informative screencast on how to use the tool:


Now, if I could only find a way to do something like this with mouse gene expression data.

Thursday, May 30, 2013

PLATO, an Alternative to PLINK

Since the near beginning of genome-wide association studies, the PLINK software package (developed by Shaun Purcell’s group at the Broad Institute and MGH) has been the standard for manipulating the large-scale data produced by these studies.  Over the course of its development, numerous features and options were added to enhance its capabilities, but it is best known for the core functionality of performing quality control and standard association tests. 

Nearly 10 years ago (around the time PLINK was just getting started), the CHGR Computational Genomics Core (CGC) at Vanderbilt University started work on a similar framework for implementing genotype QC and association tests.  This project, called PLATO, has stayed active primarily to provide functionality and control that (for one reason or another) is unavailable in PLINK.  We have found it especially useful for processing ADME and DMET panel data – it supports QC and association tests of multi-allelic variants.    

PLATO runs via command line interface, but accepts a batch file that allows users to specify an order of operations for QC filtering steps.  When running multiple QC steps in a single run of PLINK, the order of application is hard-coded and not well documented.  As a result, users wanting this level of control must run a sequence of PLINK commands, generating new data files at each step leading to longer compute times and disk usage.  PLATO also has a variety of data reformatting options for other genetic analysis programs, making it easy to run EIGENSTRAT, for example.

The detail of QC output from each of the filtering steps is much greater in PLATO, allowing output per group (founders only, parents only, etc), and giving more details on why samples fail sex checks, Hardy-Weinberg checks, and Mendelian inconsistencies to facilitate deeper investigation of these errors.  And with family data, disabling samples due to poor genotype quality retains pedigree information useful for phasing and transmission tests. Full documentation and download links can be found here (https://chgr.mc.vanderbilt.edu/plato).  Special thanks to Yuki Bradford in the CGC for her thoughts on this post.  

Tuesday, March 19, 2013

Software Carpentry Bootcamp at University of Virginia

A couple of weeks ago I, with the help of others here at UVA, organized a Software Carpentry bootcamp, instructed by Steve Crouch, Carlos Anderson, and Ben Morris. The day before the course started, Charlottesville was racked by nearly a foot of snow, widespread power outages, and many cancelled incoming flights. Luckily our instructors arrived just in time, and power was (mostly) restored shortly before the boot camp started. Despite the conditions, the course was very well-attended.

Software Carpentry's aim is to teach researchers (usually graduate students) basic computing concepts and skills so that they can get more done in less time, and with less pain. They're a volunteer organization funded by Mozilla and the Sloan foundation, and led this two-day bootcamp completely free of charge to us.

The course started out with a head-first dive into Unix and Bash scripting, followed by a tutorial on automation with Make, concluding the first day with an introduction to Python. The second day covered version control with git, Python code testing, and wrapped up with an introduction to databases and SQL. At the conclusion of the course, participants offered near-universal positive feedback, with the git and Make tutorials being exceptionally popular.

Software Carpentry's approach to teaching these topics is unlike many others that I've seen. Rather than lecturing on for hours, the instructors inject very short (~5 minute) partnered exercises between every ~15 minutes of instruction in 1.5 hour sessions. With two full days of intensive instruction and your computer in front of you, it's all too easy to get distracted by an email, get lost in your everyday responsibilities, and zone out for the rest of the session.  The exercises keep participants paying attention and accountable to their partner.

All of the bootcamp's materials are freely available:

Unix and Bash: https://github.com/redcurry/bash_tutorial
Python Introduction: https://github.com/redcurry/python_tutorial
Git tutorial: https://github.com/redcurry/git_tutorial
Databases & SQL: https://github.com/bendmorris/swc_databases
Everything else: http://users.ecs.soton.ac.uk/stc/SWC/tutorial-materials-virginia.zip

Perhaps more relevant to a broader audience are the online lectures and materials available on the Software Carpentry Website, which include all the above topics, as well as many others.

We capped the course at 50, and had 95 register within a day of opening registration, so we'll likely do this again in the future. I sit in countless meetings where faculty lament how nearly all basic science researchers enter grad school or their postdoc woefully unprepared for this brave new world of data-rich high-throughput science. Self-paced online learning works well for some, but if you're in a department or other organization that could benefit from a free, on-site, intensive introduction to the topics listed above, I highly recommend contacting Software Carpentry and organizing your own bootcamp.

Finally, when organizing an optional section of the course, we let participants vote whether they preferred learning number crunching with NumPy, or SQL/databases; SQL won by a small margin. However, Katherine Holcomb in UVACSE has graciously volunteered to teach a two-hour introduction to NumPy this week, regardless of whether you participated in the boot camp (although some basic Python knowledge is recommended). This (free) short course is this Thursday, March 21, 2-4pm, in the same place as the bootcamp (Brown Library Classroom in Clark Hall). Sign up here.

Monday, March 4, 2013

Comparing Sequence Classification Algorithms for Metagenomics

Metagenomics is the study of DNA collected from environmental samples (e.g., seawater, soil, acid mine drainage, the human gut, sputum, pus, etc.). While traditional microbial genomics typically means sequencing a pure cultured isolate, metagenomics involves taking a culture-free environmental sample and sequencing a single gene (e.g. the 16S rRNA gene), multiple marker genes, or shotgun sequencing everything in the sample in order to determine what's there.

A challenge in shotgun metagenomics analysis is the sequence classification problem: i.e., given a sequence, what's it's origin? I.e., did this sequence read come from E. coli or some other enteric bacteria? Note that sequence classification does not involve genome assembly - sequence classification is done on unassembled reads. If you could perfectly classify the origin of every sequence read in your sample, you would know exactly what organisms are in your environmental sample and how abundant each one is.

The solution to this problem isn't simply BLAST'ing every sequence read that comes off your HiSeq 2500 against NCBI nt/nr. The computational cost of this BLAST search would be many times more expensive than the sequencing itself. There are many algorithms for sequence classification. This paper examines a wide range of the available algorithms and software implementations for sequence classification as applied to metagenomic data:

Bazinet, Adam L., and Michael P. Cummings. "A comparative evaluation of sequence classification programs." BMC Bioinformatics 13.1 (2012): 92.

In this paper, the authors comprehensively evaluated the performance of over 25 programs that fall into three categories: alignment-based, composition-based, and phylogeny-based. For illustrative purposes, the authors constructed a "phylogenetic tree" that shows how each of the 25 methods they evaluated are related to each other:

Figure 1: Program clustering. A neighbor-joining tree that clusters the classification programs based on their similar attributes.

The performance evaluation was done on several different datasets where the composition was known, using a similar set of evaluation criteria (sensitivity = number of correct assignments / number of sequences in the data; precision = number of correct assignments/number of assignments made). They concluded that the performance of particular methods varied widely between datasets due to reasons like highly variable taxonomic composition and diversity, level of sequence representation in underlying databases, read lengths, and read quality. The authors specifically point out that just because some methods lack sensitivity (as they've defined it), they are still useful because they have high precision. For example, marker-based approaches (like Metaphyler) might only classify a small number of reads, but they're highly precise, and may still be enough to accurately recapitulate organismal distribution and abundance.

Importantly, the authors note that you can't ignore computational requirements, which varied by orders of magnitude between methods. Selection of the right method depends on the goals (is sensitivity or precision more important?) and the available resources (time and compute power are never infinite - these are tangible limitations that are imposed in the real world).

This paper was first received at BMC Bioinformatics a year ago, and since then many new methods for sequence classification have been published. Further, this paper only evaluates methods for classification of unassembled reads, and does not evaluate methods that rely on metagenome assembly (that's the subject of another much longer post, but check out Titus Brown's blog for lots more on this topic).

Overall, this paper was a great demonstration of how one might attempt to evaluate many different tools ostensibly aimed at solving the same problem but functioning in completely different ways.

Bazinet, Adam L., and Michael P. Cummings. "A comparative evaluation of sequence classification programs." BMC Bioinformatics 13.1 (2012): 92.

Tuesday, January 8, 2013

Stop Hosting Data and Code on your Lab Website

It's happened to all of us. You read about a new tool, database, webservice, software, or some interesting and useful data, but when you browse to http://instititution.edu/~home/professorX/lab/data, there's no trace of what you were looking for.

THE PROBLEM

This isn't an uncommon problem. See the following two articles:
Schultheiss, Sebastian J., et al. "Persistence and availability of web services in computational biology." PLoS one 6.9 (2011): e24914. 
Wren, Jonathan D. "404 not found: the stability and persistence of URLs published in MEDLINE." Bioinformatics 20.5 (2004): 668-672.
The first gives us some alarming statistics. In a survey of nearly 1000 web services published in the Nucleic Acids Web Server Issue between 2003 and 2009:
  • Only 72% were still available at the published address.
  • The authors could not test the functionality for 33% because there was no example data, and 13% no longer worked as expected.
  • The authors could only confirm positive functionality for 45%.
  • Only 274 of the 872 corresponding authors answered an email.
  • Of these 78% said a service was developed by a student or temporary researcher, and many had no plan for maintenance after the researcher had moved on to a permanent position.
The Wren et al. paper found that of 1630 URLs identified in Pubmed abstracts, only 63% were consistently available. That rate was far worse for anonymous login FTP sites (33%).

OpenHelix recently started this thread on Biostar as an obituary section for bioinformatics tools and resources that have vanished.

It's a fact that most of us academics move around a fair amount. Often we may not deem a tool we developed or data we collected and released to be worth transporting and maintaining. After some grace period, the resource disappears without a trace. 

SOFTWARE

I won't spend much time here because most readers here are probably aware of source code repositories for hosting software projects. Unless you're not releasing the source code to your software (aside: starting an open-source project is a way to stake a claim in a field, not a real risk for getting yourself scooped), I can think of no benefit for hosting your code on your lab website when there are plenty of better alternatives available, such as Sourceforge, GitHub, Google Code, and others. In addition to free project hosting, tools like these provide version control, wikis, bug trackers, mailing lists and other services to enable transparent and open development with the end result of a better product and higher visibility. For more tips on open scientific software development, see this short editorial in PLoS Comp Bio:

Prlić A, Procter JB (2012) Ten Simple Rules for the Open Development of Scientific Software. PLoS Comput Biol 8(12): e1002802. 

Casey Bergman recently analyzed where bioinformaticians are hosting their code, where he finds that the growth rate of Github is outpacing both Google Code and Sourceforge. Indeed, Github hosts more repositories than there are articles in Wikipedia, and has an excellent tutorial and interactive learning modules to help you learn how to use it. However, Bergman also points out how easy it is to delete a repository from Github and Google Code, where repositories are published by individuals who hold the keys to preservation (as opposed to Sourceforge, where it is extremely difficult to remove a project once it's been released).

DATA, FIGURES, SLIDES, WEB SERVICES, OR ANYTHING ELSE

For everything else there's Figshare. Figshare lets you host and publicly share unlimited data (or store data privately up to 1GB). The name suggests a site for sharing figures, but Figshare allows you to permanently store and share any research object. That can be figures, slides, negative results, videos, datasets, or anything else. If you're running a database server or web service, you can package up the source code on one of the repositories mentioned above, and upload to Figshare a virtual machine image of the server running it, so that the service will be available to users long after you've lost the time, interest, or money to maintain it.

Research outputs stored at Figshare are archived in the CLOCKSS geographically and geopolitically distributed network of redundant archive nodes, located at 12 major research libraries around the world. This means that content will remain available indefinitely for everyone after a "trigger event," and ensures this work will be maximally accessible and useful over time. Figshare is hosted using Amazon Web Services to ensure the highest level of security and stability for research data. 

Upon uploading your data to Figshare, your data becomes discoverable, searchable, shareable, and instantly citable with its own DOI, allowing you to instantly take credit for the products of your research. 

To show you how easy this is, I recently uploaded a list of "consensus" genes generated by Will Bush where Ensembl refers to an Entrez-gene with the same coordinates, and that Entrez-gene entry refers back to the same Ensembl gene (discussed in more detail in this previous post).

Create an account, and hit the big upload link. You'll be given a screen to drag and drop anything you'd like here (there's also a desktop uploader for larger files).


Once I dropped in the data I downloaded from Vanderbilt's website linked from the original blog post, I enter some optional metadata, a description, a link back to the original post:


I then instantly receive a citeable DOI where the data is stored permanently, regardless of Will's future at Vanderbilt:

Ensembl/Entrez hg19/GRCh37 Consensus Genes. Stephen Turner. figshare. Retrieved 21:31, Dec 19, 2012 (GMT). http://dx.doi.org/10.6084/m9.figshare.103113

There are also links to the side that allow you to export that citation directly to your reference manager of choice.

Finally, as an experiment, I also uploaded this entire blog post to Figshare, which is now citeable and permanently archived at Figshare:

Stop Hosting Data and Code on your Lab Website. Stephen Turner. figshare. Retrieved 22:51, Dec 19, 2012 (GMT). http://dx.doi.org/10.6084/m9.figshare.105125.

Friday, January 4, 2013

Twitter Roundup, January 4 2013

I've said it before: Twitter makes me a lazy blogger. Lots of stuff came across my radar this week that didn't make it into a full blog post. Here's a quick recap:

PLOS Computational Biology: Chapter 1: Biomedical Knowledge Integration

Assuring the quality of next-generation sequencing in clinical laboratory practice : Nature Biotechnology

De novo genome assembly: what every biologist should know : Nature Methods

How deep is deep enough for RNA-Seq profiling of bacterial transcriptomes?

Silence | Abstract | Strand-specific libraries for high throughput RNA sequencing (RNA-Seq) prepared without poly(A) selection

BMC Genomics | Abstract | Comparison of metagenomic samples using sequence signatures

Peak identification for ChIP-seq data with no controls.

TrueSight: a new algorithm for splice junction detection using RNA-seq

DiffCorr: An R package to analyze and visualize differential correlations in biological networks.

PLOS ONE: Reevaluating Assembly Evaluations with Feature Response Curves: GAGE and Assemblathons

Delivering the promise of public health genomics | Global Development Professionals Network

Metagenomics and Community Profiling: Culture-Independent Techniques in the Clinical Laboratory

PLOS ONE: A Model-Based Clustering Method for Genomic Structural Variant Prediction and Genotyping Using Paired-End Sequencing Data

InnoCentive - Metagenomics Challenge

Wednesday, January 2, 2013

Computing for Data Analysis, and Other Free Courses

Coursera's free Computing for Data Analysis course starts today. It's a four week long course, requiring about 3-5 hours/week. A bit about the course:
In this course you will learn how to program in R and how to use R for effective data analysis. You will learn how to install and configure software necessary for a statistical programming environment, discuss generic programming language concepts as they are implemented in a high-level statistical language. The course covers practical issues in statistical computing which includes programming in R, reading data into R, creating informative data graphics, accessing R packages, creating R packages with documentation, writing R functions, debugging, and organizing and commenting R code. Topics in statistical data analysis and optimization will provide working examples.
There are also hundreds of other free courses scheduled for this year. While the Computing for Data Analysis course is more about using R, the Data Analysis course is more about the methods and experimental designs you'll use, with a smaller emphasis on the R language. There are also courses on Scientific ComputingAlgorithmsHealth Informatics in the CloudNatural Language ProcessingIntroduction to Data ScienceScientific WritingNeural NetworksParallel ProgrammingStatistics 101Systems BiologyData Management for Clinical Research, and many, many others. See the link below for the full listing.

Free Courses on Coursera

Friday, November 2, 2012

STAR: ultrafast universal RNA-seq aligner

There's a new kid on the block for RNA-seq alignment.

Dobin, Alexander, et al. "STAR: ultrafast universal RNA-seq aligner." Bioinformatics (2012).

Aligning RNA-seq data is challenging because reads can overlap splice junctions. Many other RNA-seq alignment algorithms (e.g. Tophat) are built on top of DNA sequence aligners. STAR (Spliced Transcripts Alignment to a Reference) is a standalone RNA-seq alignment algorithm that uses uncompressed suffix arrays and a mapping algorithm similar to those used in large-scale genome alignment tools to align RNA-seq reads to a genomic reference. STAR is over 50 times faster than any other previously published RNA-seq aligner, and outperforms other aligners in both sensitivity and specificity using both simulated and real (replicated) RNA-seq data.


The notable increase in speed comes at the price of a larger memory requirement. STAR requires ~27GB RAM to align reads to a human genome - a moderate amount, but not atypical on most modern servers. STAR aligns ~45 million paired reads per hour per processor, and scales nearly linearly with the number of processors (without appreciably increasing RAM usage). Notably, the STAR algorithm is also capable of handling longer reads such as those from PacBio and the upcoming Oxford Nanopore technologies. STAR is free and open source software.

Dobin, Alexander, et al. "STAR: ultrafast universal RNA-seq aligner." Bioinformatics (2012).

STAR software on Google Code

(This post adapted from my review on F1000).

Wednesday, May 16, 2012

Stepping Outside My Open-Source Comfort Zone: A First Look at Golden Helix SVS

I'm a huge supporter of the Free and Open Source Software movement. I've written more about R than anything else on this blog, all the code I post here is free and open-source, and a while back I invited you to steal this blog under a cc-by-sa license.

Every now and then, however, something comes along that just might be worth paying for. As a director of a bioinformatics core with a very small staff, I spend a lot of time balancing costs like software licensing versus personnel/development time, so that I can continue to provide a fiscally sustainable high-quality service.

As you've likely noticed from my more recent blog/twitter posts, the core has been doing a lot of gene expression and RNA-seq work. But recently had a client who wanted to run a fairly standard case-control GWAS analysis on a dataset from dbGaP. Since this isn't the focus of my core's service, I didn't want to invest the personnel time in deploying a GWAS analysis pipeline, downloading and compiling all the tools I would normally use if I were doing this routinely, and spending hours on forums trying to remember what to do with procedural issues such as which options to specify when running EIGENSTRAT or KING, or trying to remember how to subset and LD-prune a binary PED file, or scientific issues, such as whether GWAS data should be LD-pruned at all before doing PCA.

Golden Helix

A year ago I wrote a post about the "Hitchhiker's Guide to Next-Gen Sequencing" by Gabe Rudy, a scientist at Golden Helix. After reading this and looking through other posts on their blog, I'm confident that these guys know what they're doing and it would be worth giving their product a try. Luckily, I had the opportunity to try out their SNP & Variation Suite (SVS) software (I believe you can also get a free trial on their website).

I'm not going to talk about the software - that's for a future post if the core continues to get any more GWAS analysis projects. In summary - it was fairly painless to learn a new interface, import the data, do some basic QA/QC, run a PCA-adjusted logistic regression, and produce some nice visualization. What I want to highlight here is the level of support and documentation you get with SVS.

Documentation

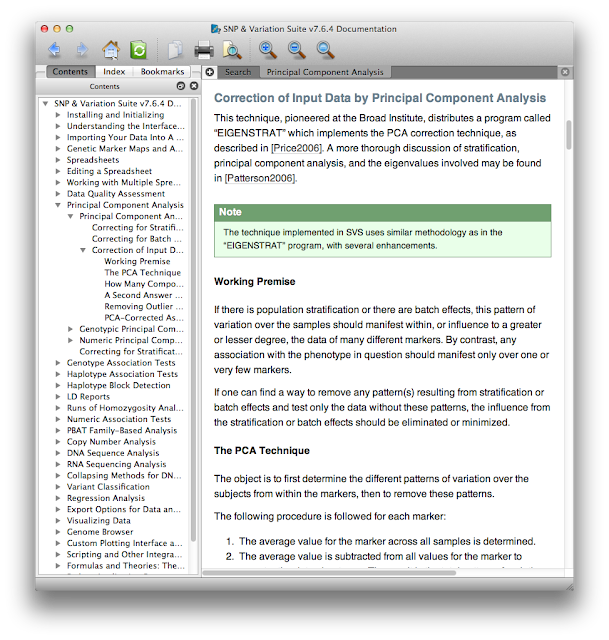
First, the documentation. At each step from data import through analysis and visualization there's a help button that opens up the manual at the page you need. This contextual manual not only gives operational details about where you click or which options to check, but also gives scientific explanations of why you might use certain procedures in certain scenarios. Here's a small excerpt of the context-specific help menu that appeared when I asked for help doing PCA.

What I really want to draw your attention to here is that even if you don't use SVS you can still view their manual online without registering, giving them your e-mail, or downloading any trialware. Think of this manual as an always up-to-date mega-review of GWAS - with it you can learn quite a bit about GWAS analysis, quality control, and statistics. For example, see this section on haplotype frequency estimation and the EM algorithm. The section on the mathematical motivation and implementation of the Eigenstrat PCA method explains the method perhaps better than the Eigenstrat paper and documentation itself. There are also lots of video tutorials that are helpful, even if you're not using SVS. This is a great resource, whether you're just trying to get a better grip on what PLINK is doing, or perhaps implementing some of these methods in your own software.

Support

Next, the support. After installing SVS on both my Mac laptop and the Linux box where I do my heavy lifting, one of the product specialists at Golden Helix called me and walked me through every step of a GWAS analysis, from QC to analysis to visualization. While analyzing the dbGaP data for my client I ran into both software-specific procedural issues as well as general scientific questions. If you've ever asked a basic question on the R-help mailing list, you know need some patience and a thick skin for all the RTFM responses you'll get. I was able to call the fine folks at Golden Helix and get both my technical and scientific questions answered in the same day. There are lots of resources for getting your questions answered, such as SEQanswers, Biostar, Cross Validated, and StackOverflow to name a few, but getting a forum response two days later from "SeqGeek96815" doesn't compare to having a team of scientists, statisticians, programmers, and product specialists on the other end of a telephone whose job it is to answer your questions.

Final Thoughts

This isn't meant to be a wholesale endorsement of Golden Helix or any other particular software company - I only wanted to share my experience stepping outside my comfortable open-source world into the walled garden of a commercially-licensed software from a for-profit company (the walls on the SVS garden aren't that high in reality - you can import and export data in any format imaginable). One of the nice things about command-line based tools is that it's relatively easy to automate a simple (or at least well-documented) process with tools like Galaxy, Taverna, or even by wrapping them with perl or bash scripts. However, the types of data my clients are collecting and the kinds of questions they're asking are always a little new and different, which means I'm rarely doing the same exact analysis twice. Because of the level of documentation and support provided to me, I was able to learn a new interface to a set of familiar procedures and run an analysis very quickly and without spending hours on forums figuring out why a particular program is seg-faulting. Will I abandon open-source tools like PLINK for SVS, Tophat-Cufflinks for CLC Workbench, BWA for NovoAlign, or R for Stata? Not in a million years. I haven't talked to Golden Helix or some of the above-mentioned companies about pricing for their products, but if I can spend a few bucks and save the time it would taken a full time technician at $50k+/year to write a new short read aligner or build a new SNP annotation database server, then I'll be able to provide a faster, high-quality, fiscally sustainable service at a much lower price for the core's clients, which is all-important in a time when federal funding is increasingly harder to come by.

Tuesday, January 17, 2012

Annotating limma Results with Gene Names for Affy Microarrays

Lately I've been using the limma package often for analyzing microarray data. When I read in Affy CEL files using ReadAffy(), the resulting ExpressionSet won't contain any featureData annotation. Consequentially, when I run topTable to get a list of differentially expressed genes, there's no annotation information other than the Affymetrix probeset IDs or transcript cluster IDs. There are other ways of annotating these results (INNER JOIN to a MySQL database, biomaRt, etc), but I would like to have the output from topTable already annotated with gene information. Ideally, I could annotate each probeset ID with a gene symbol, gene name, Ensembl ID, and have that Ensembl ID hyperlink out to the Ensembl genome browser. With some help from Gordon Smyth on the Bioconductor Mailing list, I found that annotating the ExpressionSet object results in the output from topTable also being annotated.

The results from topTable are pretty uninformative without annotation:


After annotation:


You can generate an HTML file with clickable links to the Ensembl Genome Browser for each gene:


Here's the R code to do it:

Monday, August 22, 2011

Estimating Trait Heritability from GWAS Data

Peter Visscher and colleagues have recently published a flurry of papers employing a new software package called GCTA to estimate the heritability of traits using GWAS data (GCTA stands for Genome-wide Complex Trait Analysis -- clever acronymity!). The tool, supported (and presumably coded) by Jian Yang is remarkably easy to use, based in part on the familiar PLINK commandline interface. The GCTA Homepage provides an excellent walk-through of the available options.

The basic idea is to use GWAS data to estimate the degree of "genetic sharing" or relatedness among the samples, computing what the authors call a genetic relationship matrix (GRM). The degree of genetic sharing among samples is then related to the amount of phenotypic sharing using restricted maximum likelihood analysis (REML). The result is an estimate of the variance explained by the SNPs used to generate the GRM. Full details of the stats along with all the gory matrix notation can be found in their software publication.

The approach has been applied to several disorders studied by the WTCCC and to a recent study of human height. Interestingly, the developers have also used the approach to partition the trait variance across chromosomes, resulting in something similar to population-based variance-components linkage analysis. The approach works for both quantitative and dichotomous traits, however the authors warn that variance estimates of dichotomous trait liability are influenced by genotyping artifacts.

The package also includes several other handy features, including a relatively easy way to estimate principal components for population structure correction, a GWAS simulation tool, and a regression-based LD mapping tool. Download and play -- a binary is available for Linux, MacOS, and DOS/Windows.

Thursday, May 19, 2011

More Command-Line Text Munging Utilities

In a previous post I linked to gcol as a quick and intuitive alternative to awk. I just stumbled across yet another set of handy text file manipulation utilities from the creators of the BEAGLE software for GWAS data imputation and analysis. In addition to several command line utilities for converting and formatting BEAGLE files, there are several tools for doing basic text processing tasks on the command line:

  • changecolumn.jar - replace values in a column of an input file.
  • changeline.jar - replace values in a line of an input file.
  • cut.jar - extract columns from a file.
  • filtercolumns.jar - filters columns of input data according to the values in a line.
  • filterlines.jar - filters lines of input data according to the values in a column.
  • paste.jar - pastes together files that have shared initial columns followed by data columns.
  • transpose.jar - transposes rows and columns of an input file. 
Much of what these tools do can probably be emulated with some creativity with Unix commands and pipes. But since these are all Java archives they should work on any platform, not just Unix/Linux. Hit the link below to see the full list and documentation.

BEAGLE Utilities for text manipulation

Monday, May 16, 2011

gcol == awk++

A while back Will showed you how to ditch Excel for awk, a handy Unix command line tool for extracting certain rows and columns from a text file. While I was browsing the documentation on the previously mentioned PLINK/SEQ library, I came across gcol, another utility for extracting columns from a tab-delimited text file. It can't do anything that awk can't, but it's easier and more intuitive to use for simple text munging tasks. Take a quick look at the gcol examples to see what I mean. And remember, if you need to convert a CSV to a tab-delimited file, just use sed with a Perl regexp: sed -r 's/,/\t/g' myfile.csv

For a demonstration of several other "data science hand tools", check out this post at O'Reilly that covers other handy Unix utilities such as grep, colrm, awk, find, xargs, sort, uniq, and others.

gcol - get columns text utility

Wednesday, May 4, 2011

PLINK/SEQ for Analyzing Large-Scale Genome Sequencing Data

PLINK/SEQ is an open source C/C++ library for analyzing large-scale genome sequencing data. The library can be accessed via the pseq command line tool, or through an R interface. The project is developed independently of PLINK but it's syntax will be familiar to PLINK users.

PLINK/SEQ boasts an impressive feature set for a project still in the beta testing phase. It supports several data types (multiallelic, phased, imputation probabilities, indels, and structural variants), and can handle datasets much larger than what can fit into memory. PLINK/SEQ also comes bundled with several reference databases of gene transcripts and sequence & variation projects, including dbSNP and 1000 Genomes Project data.

As with PLINK, the documentation is good, and there's a tutorial using 1000 Genomes Project data.

PLINK/SEQ - A library for the analysis of genetic variation data
Creative Commons License
Getting Genetics Done by Stephen Turner is licensed under a Creative Commons Attribution-NonCommercial 3.0 Unported License.