Reposted from the original at: https://blog.stephenturner.us/p/r-production-ai
...
Python isn't the only game in town anymore: R can interact with local and cloud LLM APIs, inspect and modify your local R environment and files, implement RAG, computer vision, NLP, evals, & much more.
There was a time in late 2023 to early 2024 when I and probably many others in the R community felt like R was falling woefully behind Python in tooling for development using AI and LLMs. This is no longer the case. The R community, and Posit in particular, have been on an absolute tear bringing new packages online to take advantage of all the capabilities that LLMs provide. Here are a few that I’ve used and others I’m keeping a close eye on as they mature.
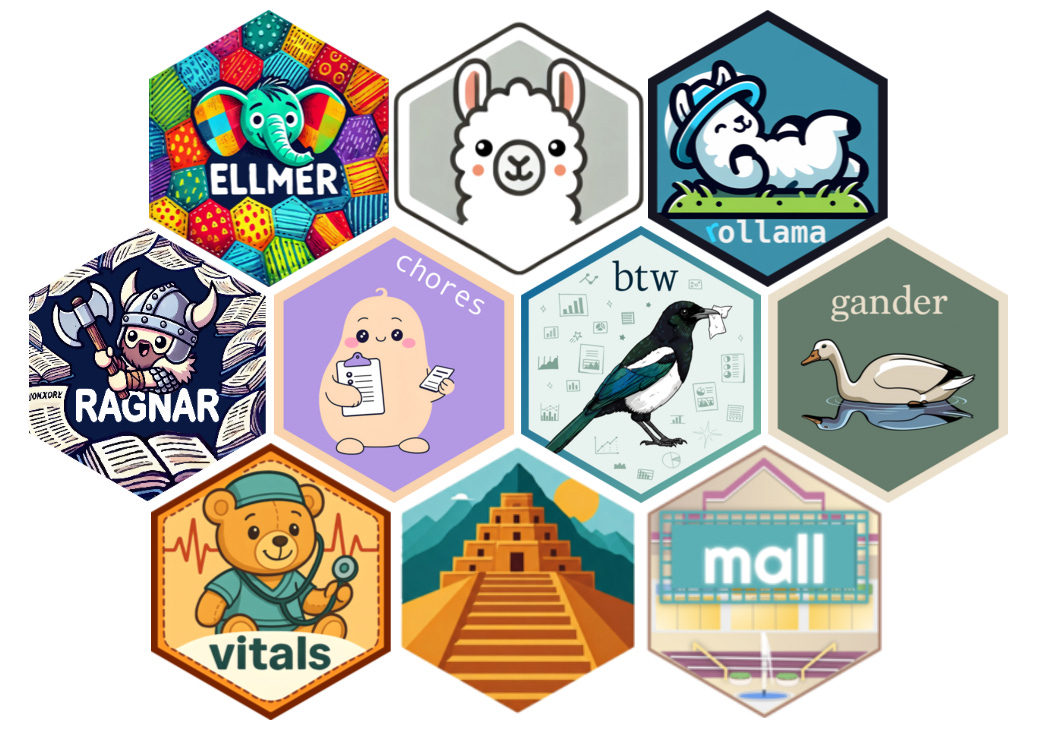
ellmer: interact with almost any LLM in R
Documentation: https://ellmer.tidyverse.org/
Blog post: https://posit.co/blog/announcing-ellmer/
I can't remember when I first started using Ollama to interact with local LLMs like Llama and Gemma, but I first used the ollamar package (CRAN, GitHub, pkgdown) last summer, and wrote a post on using this package to ask Llama3.1 what’s interesting about a set of genes, or to summarize papers on bioRxiv.

Shortly after that, I wrote an R package to summarize bioRxiv preprints with a local LLM using ollamar:

In addition to the ollamar package, Johannes Gruber introduced the rollama package (CRAN, GitHub, pkgdown) around the same time, though I haven’t used it myself.
Earlier this year Posit announced ellmer, a new package that allows you to interact with most major LLM providers, not just local models running via Ollama. The ellmer package supports ChatGPT, Claude, AWS Bedrock, Azure OpenAI, DeepSeek, Gemini, Hugging Face, Mistral, Perplexity, and others. It also supports streaming and tool calling. I wrote another post more recently demonstrating how to summarize Bluesky posts on a particular topic using ellmer:

The ellmer package’s documentation and vignettes are top-notch. Check it out.
chores: automate repetitive tasks
Documentation: https://simonpcouch.github.io/chores/
Blog post: https://posit.co/blog/introducing-chores/
The chores package connects ellmer to your source editor in RStudio and Positron, providing a library of ergonomic LLM assistants designed to help you complete repetitive, hard-to-automate tasks quickly. These “assistants” let you do things like highlight some code and convert tests to testthat3, document functions with roxygen, or convert error handling to use cli instead of stop or rlang. There’s a nice demonstration screencast on the documentation website.

gander: allow an LLM to talk to your R environment
Documentation: https://simonpcouch.github.io/gander/
Blog post: https://posit.co/blog/introducing-gander/
The gander package feels kind of like a Copilot but it also knows how to talk to objects in your R environment. It can inspect file contents from elsewhere in the project that you're working on, and it also has context about objects in your environment, like variables, data frames, and functions. There’s a nice demonstration screencast on the documentation website.

btw: describe your R environment to an LLM
CRAN: (Not yet on CRAN)
Documentation: https://posit-dev.github.io/btw/
Blog post: https://posit.co/blog/custom-chat-app/
The btw package is brand new and still in development. You can use it interactively, where it assembles context on your R environment, package documentation, and working directory, copying the results to your clipboard for easy pasting into chat interfaces. It also allows you to wrap methods that can be easily incorporated into ellmer tool calls for describing various kinds of objects in R. I’d recommend reading Posit’s “Teaching chat apps about R packages” blog post.

ragnar: retrieval-augmented generation (RAG) in R
Documentation: https://ragnar.tidyverse.org/
The ragnar R package helps implement Retrieval-Augmented Generation (RAG) workflows in R using ellmer to connect to any LLM you wish on the backend. It provides some really handy utility functions for reading files or entire websites into a data frame, converting files to markdown, and finding all links on a webpage to ingest. It helps you chunk text into sections, embed into a vector store (using duckdb by default), and retrieve relevant chunks to provide an LLM with context given a prompt.
I’m working on another post right now with a deeper dive into using ragnar.

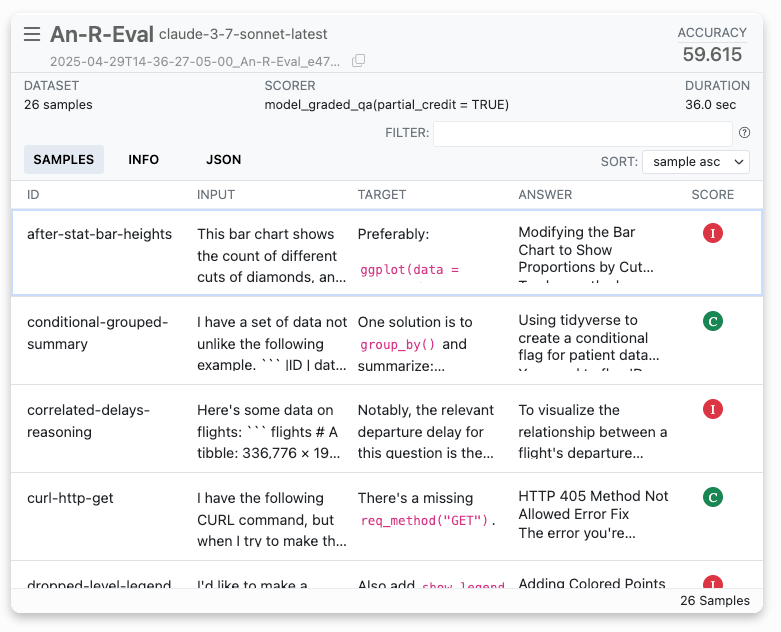
vitals: LLM evaluations in R
CRAN: (Not yet on CRAN)
Documentation: https://vitals.tidyverse.org/
LLM evaluation at R, aimed at ellmer users. It’s an R port of the widely adopted Python framework Inspect. As of this writing, the documentation notes that vitals is highly experimental and much of its documentation is aspirational.
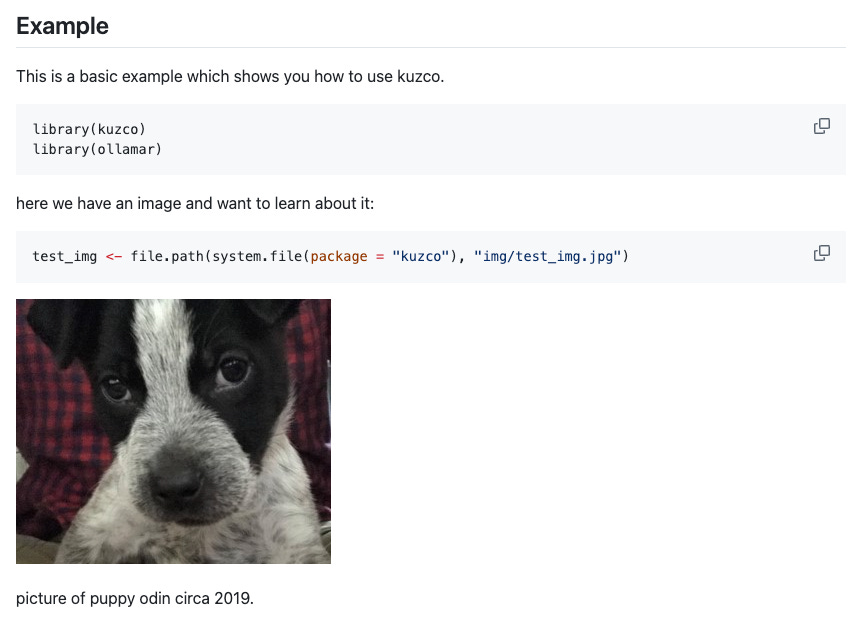
kuzco: computer vision in R
CRAN: (Not yet on CRAN)
Documentation: (No pkgdown site yet)
Blog post: https://posit.co/blog/kuzco-computer-vision-with-llms-in-r/
The kuzco package is designed as a computer vision assistant, giving local models guidance on classifying images and return structured data. The goal is to standardize outputs for image classification and use LLMs as an alternative option to keras or torch. It currently supports classification, recognition, sentiment, and text extraction.
mall: use an LLM for NLP on your data
GitHub: https://github.com/mlverse/mall
Documentation: https://mlverse.github.io/mall/
The mall package provides several convenience functions for sentiment analysis, text summarization, text classification, extraction, translation, and verification.
I recently used the mall package to run a quick sentiment analysis of #Rstats posts on Bluesky:
Functions in the mall package integrate smoothly with piped workflows in dplyr. For example:
reviews |>
llm_sentiment(review)Other resources
I think this is just the tip of the iceberg, and I can’t wait to see what else Posit and others in the R community are doing in this space.
Here's a recording from a recent webinar Joe Cheng (Posit CTO) gave on harnessing LLMs for data analysis.
You might also take a look at the recordings from posit::conf(2024) which include a few AI/LLM-focused talks.
Also check out the posit::conf(2025) schedule at https://posit.co/conference/. There’s a workshop on Programming with LLM APIs: A Beginner’s Guide in R and Python, four talks in a session titled LLMs with R and Python, several lightning talks that will likely cover LLMs in R, and four more talks in a session titled Facepalm-driven Development: Learning From AI and Human Errors.
The R community has clearly stepped up. Whether you're building prototypes, shipping production tools, or just exploring what LLMs can do, R is now a real and robust option. I’m excited to see where we go from here.
