Wednesday, July 24, 2013

Archival, Analysis, and Visualization of #ISMBECCB 2013 Tweets

As the 2013 ISMB/ECCB meeting is winding down, I archived and analyzed the 2000+ tweets from the meeting using a set of bash and R scripts I previously blogged about.

The archive of all the tweets tagged #ISMBECCB from July 19-24, 2013 is and will forever remain here on Github. You'll find some R code to parse through this text and run the analyses below in the same repository, explained in more detail in my previous blog post.

Number of tweets by date:


Number of tweets by hour:


Most popular hashtags, other than #ismbeccb. With separate hashtags for each session, this really shows which other SIGs and sessions were well-attended. It also shows the popularity of the unofficial ISMB BINGO card.


Most prolific users. I'm not sure who or what kind of account @sciencstream is - seems like spam to me.


And the obligatory word cloud:


Friday, July 12, 2013

Course Materials from useR! 2013 R/Bioconductor for Analyzing High-Throughput Genomic Data

At last week's 2013 useR! conference in Albacete, Spain, Martin Morgan and Marc Carlson led a course on using R/Bioconductor for analyzing next-gen sequencing data, covering alignment, RNA-seq, ChIP-seq, and sequence annotation using R. The course materials are online here, including R code for running the examples, the PDF vignette tutorial, and the course material itself as a package.


Course Materials from useR! 2013 R/Bioconductor for Analyzing High-Throughput Genomic Data

Tuesday, July 2, 2013

Customize your .Rprofile and Keep Your Workspace Clean

Like your .bashrc, .vimrc, or many other dotfiles you may have in your home directory, your .Rprofile is sourced every time you start an R session. On Mac and Linux, this file is usually located in ~/.Rprofile. On Windows it's buried somewhere in the R program files. Over the years I've grown and pruned my .Rprofile to set various options and define various "utility" functions I use frequently at the interactive prompt.

One of the dangers of defining too many functions in your .Rprofile is that your code becomes less portable, and less reproducible. For example, if I were to define adf() as a shortcut to as.data.frame(), code that I send to other folks using adf() would return errors that the adf object doesn't exist. This is a risk that I'm fully aware of in regards to setting the option stringsAsFactors=FALSE,  but it's a tradeoff I'm willing to accept for convenience. Most of the functions I define here are useful for exploring interactively. In particular, the n() function below is handy for getting a numbered list of all the columns in a data frame; lsp() and lsa() list all functions in a package, and list all objects and classes in the environment, respectively (and were taken from Karthik Ram's .Rprofile); and the o() function opens the current working directory in a new Finder window on my Mac. In addition to a few other functions that are self-explanatory, I also turn off those significance stars, set a default CRAN mirror so it doesn't ask me all the time, and source in the biocLite() function for installing Bioconductor packages (note: this makes R require web access, which might slow down your R initialization).

Finally, you'll notice that I'm creating a new hidden environment, and defining all the functions here as objects in this hidden environment. This allows me to keep my workspace clean, and remove all objects from that workspace without nuking any of these utility functions.

I used to keep my .Rprofile synced across multiple installations using Dropbox, but now I keep all my dotfiles in a single git-versioned directory, symlinked where they need to go (usually ~/). My .Rprofile is below: feel free to steal or adapt however you'd like.

Friday, June 7, 2013

ENCODE ChIP-Seq Significance Tool: Which TFs Regulate my Genes?

I collaborate with several investigators on gene expression projects using both microarray and RNA-seq. After I show a collaborator which genes are dysregulated in a particular condition or tissue, the most common question I get is "what are the transcription factors regulating these genes?"

This isn't the easiest question to answer. You could look at transcription factor binding site position weight matrices like those from TRANSFAC and come up with a list of all factors that potentially hit that site, then perform some kind of enrichment analysis on that. But this involves some programming, and is based solely on sequence motifs, not experimental data.

The ENCODE consortium spent over $100M and generated hundreds of ChIP-seq experiments for different transcription factors and histone modifications across many cell types (if you don't know much about ENCODE, go read the main ENCODE paper, and Sean Eddy's very fair commentary). Regardless of what you might consider "biologically functional", the ENCODE project generated a ton of data, and much of this data is publicly available. But that still doesn't help answer our question, because genes are often bound by multiple TFs, and TFs can bind many regions. We need to perform an enrichment (read: hypergeometric) test to assess an over-representation of experimentally bound transcription factors around our gene targets of interest ("around" also implies that some spatial boundary must be specified). To date, I haven't found a good tool to do this easily.

Raymond Auerbach and Bin Chen in Atul Butte's lab recently developed a resource to address this very common need, called the ENCODE ChIP-Seq Significance Tool.

The paper: Auerbach et al. Relating Genes to Function: Identifying Enriched Transcription Factors using the ENCODE ChIP-Seq Significance Tool. Bioinformatics (2013): 10.1093/bioinformatics/btt316.

The software: ENCODE ChIP-Seq Significance Tool (http://encodeqt.stanford.edu/).

This tool takes a list of "interesting" (significant, dysregulated, etc.) genes as input, and identifies ENCODE transcription factors from this list. Head over to http://encodeqt.stanford.edu/, select the ID type you're using (Ensembl, Symbol, etc), and paste in your list of genes. You can also specify your background set (this has big implications for the significance testing using the hypergeometric distribution). Scroll down some more to tell the tool how far up and downstream you want to look from the transcription start/end site or whole gene, select an ENCODE cell line (or ALL), and hit submit. 

You're then presented with a list of transcription factors that are most likely regulating your input genes (based on overrepresentation of ENCODE ChIP-seq binding sites). Your results can then be saved to CSV or PDF. You can also click on a number in the results table and get a list of genes that are regulated by a particular factor (the numbers do not appear as hyperlinks in my browser, but clicking the number still worked).

At the very bottom of the page, you can load example data that they used in the supplement of their paper, and run through the analysis presented therein. The lead author, Raymond Auerbach, even made a very informative screencast on how to use the tool:


Now, if I could only find a way to do something like this with mouse gene expression data.

Thursday, May 30, 2013

PLATO, an Alternative to PLINK

Since the near beginning of genome-wide association studies, the PLINK software package (developed by Shaun Purcell’s group at the Broad Institute and MGH) has been the standard for manipulating the large-scale data produced by these studies.  Over the course of its development, numerous features and options were added to enhance its capabilities, but it is best known for the core functionality of performing quality control and standard association tests. 

Nearly 10 years ago (around the time PLINK was just getting started), the CHGR Computational Genomics Core (CGC) at Vanderbilt University started work on a similar framework for implementing genotype QC and association tests.  This project, called PLATO, has stayed active primarily to provide functionality and control that (for one reason or another) is unavailable in PLINK.  We have found it especially useful for processing ADME and DMET panel data – it supports QC and association tests of multi-allelic variants.    

PLATO runs via command line interface, but accepts a batch file that allows users to specify an order of operations for QC filtering steps.  When running multiple QC steps in a single run of PLINK, the order of application is hard-coded and not well documented.  As a result, users wanting this level of control must run a sequence of PLINK commands, generating new data files at each step leading to longer compute times and disk usage.  PLATO also has a variety of data reformatting options for other genetic analysis programs, making it easy to run EIGENSTRAT, for example.

The detail of QC output from each of the filtering steps is much greater in PLATO, allowing output per group (founders only, parents only, etc), and giving more details on why samples fail sex checks, Hardy-Weinberg checks, and Mendelian inconsistencies to facilitate deeper investigation of these errors.  And with family data, disabling samples due to poor genotype quality retains pedigree information useful for phasing and transmission tests. Full documentation and download links can be found here (https://chgr.mc.vanderbilt.edu/plato).  Special thanks to Yuki Bradford in the CGC for her thoughts on this post.  

Wednesday, May 15, 2013

Automated Archival and Visual Analysis of Tweets Mentioning #bog13, Bioinformatics, #rstats, and Others

Automatically Archiving Twitter Results

Ever since Twitter gamed its own API and killed off great services like IFTTT triggers, I've been looking for a way to automatically archive tweets containing certain search terms of interest to me. Twitter's built-in search is limited, and I wanted to archive interesting tweets for future reference and to start playing around with some basic text / trend analysis.

Enter t - the twitter command-line interface. t is a command-line power tool for doing all sorts of powerful Twitter queries using the command line. See t's documentation for examples.

I wrote this script that uses the t utility to search Twitter separately for a set of specified keywords, and append those results to a file. The comments at the end of the script also show you how to commit changes to a git repository, push to GitHub, and automate the entire process to run twice a day with a cron job. Here's the code as of May 14, 2013:


That script, and results for searching for "bioinformatics", "metagenomics", "#rstats", "rna-seq", and "#bog13" (the Biology of Genomes 2013 meeting) are all in the GitHub repository below. (Please note that these results update dynamically, and searching Twitter at any point could possibly result in returning some unsavory Tweets.)

https://github.com/stephenturner/twitterchive

Analyzing Tweets using R

You'll also find an analysis subdirectory, containing some R code to produce barplots showing the number of tweets per day over the last month, frequency of tweets by hour of the day, the most used hashtags within a search, the most prolific tweeters, and a ubiquitous word cloud. Much of this code is inspired by Neil Saunders's analysis of Tweets from ISMB 2012. Here's the code as of May 14, 2013:


Also in that analysis directory you'll see periodically updated plots for the results of the queries above.

Analyzing Tweets mentioning "bioinformatics"

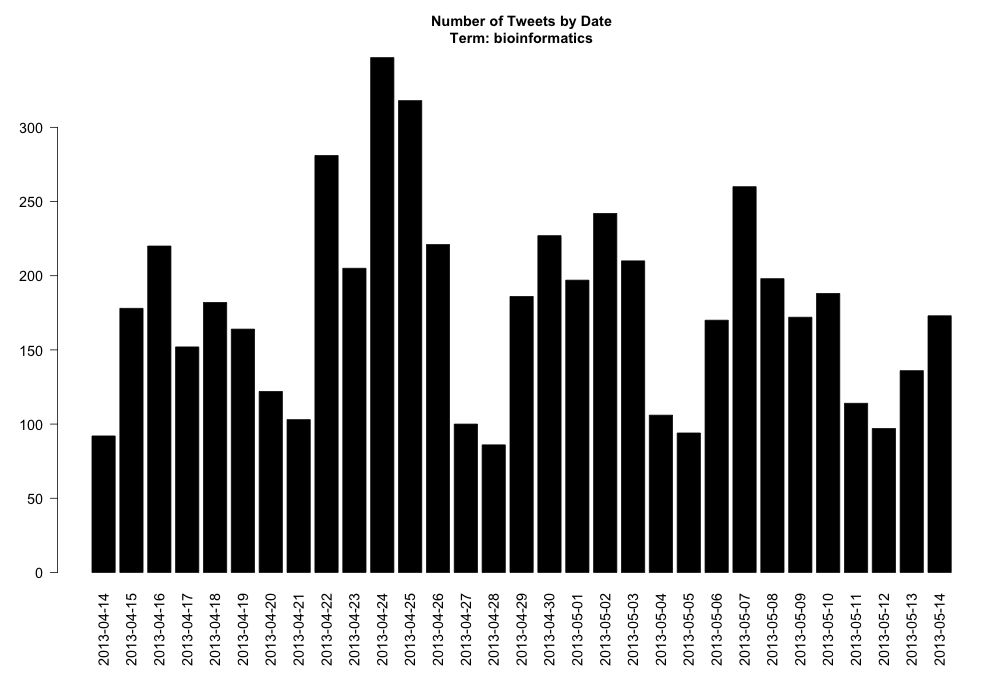
Using the bioinformatics query, here are the number of tweets per day over the last month:


Here is the frequency of "bioinformatics" tweets by hour:

Here are the most used hashtags (other than #bioinformatics):

Here are the most prolific bioinformatics Tweeps:

Here's a wordcloud for all the bioinformatics Tweets since March:

Analyzing Tweets mentioning "#bog13"

The 2013 CSHL Biology of Genomes Meeting took place May 7-11, 2013. I searched and archived Tweets mentioning #bog13 from May 1 through May 14 using this script. You'll notice in the code above that I'm no longer archiving this hashtag. I probably need a better way to temporarily add keywords to the search, but I haven't gotten there yet.

Here are the number of Tweets per day during that period. Tweets clearly peaked a couple days into the meeting, with follow-up commentary trailing off quickly after the meeting ended.


Here is the frequency frequency of Tweets by hour, clearly bimodal:

Top hashtags (other than #bog13). Interestingly #bog14 was the most highly used hashtag, so I'm guessing lots of folks are looking forward to next years' meeting. Also, #ashg12 got lots of mentions, presumably because someone presented updated work from last years' ASHG meeting.

Here were the most prolific Tweeps - many of the usual suspects here, as well as a few new ones (new to me at least):

And finally, the requisite wordcloud:


More analysis

If you look in the analysis directory of the repo you'll find plots like these for other keywords (#rstats, metagenomics, rna-seq, and others to come). I would also like to do some sentiment analysis as Neil did in the ISMB post referenced above, but the sentiment package has since been removed from CRAN. I hear there are other packages for polarity analysis, but I haven't yet figured out how to use them. I've given you the code to do the mundane stuff (parsing the fixed-width files from t, for starters). I'd love to see someone take a stab at some further text mining / polarity / sentiment analysis!

twitterchive - archive and analyze results from a Twitter search

Monday, May 6, 2013

Three Metagenomics Papers for You

A handful of good metagenomics papers have come out over the last few months. Below I've linked to and copied my evaluation of each of these articles from F1000.

...

1. Willner, Dana, and Philip Hugenholtz. "From deep sequencing to viral tagging: Recent advances in viral metagenomics." BioEssays (2013). 

My evaluation: This review lays out some of the challenges and recent advances in viral metagenomic sequencing. There is a good discussion of library preparation and how that affects downstream sequencing. Alarmingly, they reference another paper that showed that different amplification methods resulted in detection of a completely different set of viruses (dsDNA viruses with LASL, ssDNA with MDA). The review also discusses many of the data management, analysis, and bioinformatics challenges associated with viral metagenomics.

...

2. Loman, Nicholas J., et al. "A Culture-Independent Sequence-Based Metagenomics Approach to the Investigation of an Outbreak of Shiga-Toxigenic Escherichia coli O104: H4Outbreak of Shiga-toxigenic Escherichia coli." JAMA 309.14 (2013): 1502-1510.

My evaluation: This paper is a groundbreaking exploration of the use of metagenomics to investigate and determine the causal organism of an infectious disease outbreak. The authors retrospectively collected fecal samples from symptomatic patients from the 2011 Escherichia coli O104:H4 outbreak in Germany and performed high-throughput shotgun sequencing, followed by a sophisticated analysis to determine the outbreak's causal organism. The analysis included comparing genetic markers from many symptomatic patients' metagenomes with those of healthy controls, followed by de novo assembly of the outbreak strain from the shotgun metagenomic data. This illustrates both the power, but the real limitations, of using metagenomic approaches for clinical diagnostics. Also see David Relman's synopsis of the study in the same JAMA issue

...

3. Shakya, Migun, et al. "Comparative metagenomic and rRNA microbial diversity characterization using archaeal and bacterial synthetic communities." Environmental microbiology (2013).

My evaluation: This study set out to compare shotgun metagenomic sequencing to 16S rRNA amplicon sequencing to determine the taxonomic and abundance profiles of mixed community metagenomic samples. Thus far, benchmarking metagenomic methodology has been difficult due to the lack of datasets where the underlying ground truth is known. In this study, the researchers constructed synthetic metagenomic communities consisting of 64 laboratory mixed genome DNAs of known sequence and polymerase chain reaction (PCR)-validated abundance. The researchers then compared metagenomic and 16S amplicon sequencing, using both 454 and Illumina technology, and found that metagenomic sequencing outperformed 16S sequencing in quantifying community composition. The synthetic metagenomes constructed here are publicly available (Gene Expression Omnibus [GEO] accession numbers are given in the manuscript), which represent a great asset to other researchers developing methods for amplicon-based or metagenomic approaches to sequence classification, diversity analysis, and abundance estimation.

Thursday, April 4, 2013

List of Bioinformatics Workshops and Training Resources

I frequently get asked to recommend workshops or online learning resources for bioinformatics, genomics, statistics, and programming. I compiled a list of both online learning resources and in-person workshops (preferentially highlighting those where workshop materials are freely available online):

List of Bioinformatics Workshops and Training Resources

I hope to keep the page above as up-to-date as possible. Below is a snapshop of what I have listed as of today. Please leave a comment if you're aware of any egregious omissions, and I'll update the page above as appropriate.

From http://stephenturner.us/p/edu, April 4, 2013

In-Person Workshops:

Cold Spring Harbor Courses: meetings.cshl.edu/courses.html

Cold Spring Harbor has been offering advanced workshops and short courses in the life sciences for years. Relevant workshops include Advanced Sequencing Technologies & ApplicationsComputational & Comparative GenomicsProgramming for BiologyStatistical Methods for Functional Genomics, the Genome Access Course, and others. Unlike most of the others below, you won't find material from past years' CSHL courses available online.

Canadian Bioinformatics Workshops: bioinformatics.ca/workshops
Bioinformatics.ca through its Canadian Bioinformatics Workshops (CBW) series began offering one and two week short courses in bioinformatics, genomics and proteomics in 1999. The more recent workshops focus on training researchers using advanced high-throughput technologies on the latest approaches being used in computational biology to deal with the new data. Course material from past workshops is freely available online, including both audio/video lectures and slideshows. Topics include microarray analysisRNA-seq analysis, genome rearrangements, copy number alteration,network/pathway analysis, genome visualization, gene function prediction, functional annotation, data analysis using R, statistics for metabolomics, and much more.

UC Davis Bioinformatics Training Program: training.bioinformatics.ucdavis.edu
The UC Davis Bioinformatics Training program offers several intensive short bootcamp workshops on RNA-seq, data analysis and visualization, and cloud computing with a focus on Amazon's computing resources. They also offer a week-long Bioinformatics Short Course, covering in-depth the practical theory and application of cutting-edge next-generation sequencing techniques. Every course's documentation is freely available online, even if you didn't take the course.

MSU NGS Summer Course: bioinformatics.msu.edu/ngs-summer-course-2013
This intensive two week summer course will introduce attendees with a strong biology background to the practice of analyzing short-read sequencing data from Illumina and other next-gen platforms. The first week will introduce students to computational thinking and large-scale data analysis on UNIX platforms. The second week will focus on mapping, assembly, and analysis of short-read data for resequencing, ChIP-seq, and RNAseq. Materials from previous courses are freely available online under a CC-by-SA license.

Genetic Analysis of Complex Human Diseases: hihg.med.miami.edu/edu...
The Genetic Analysis of Complex Human Diseases is a comprehensive four-day course directed toward physician-scientists and other medical researchers. The course will introduce state-of-the-art approaches for the mapping and characterization of human inherited disorders with an emphasis on the mapping of genes involved in common and genetically complex disease phenotypes. The primary goal of this course is to provide participants with an overview of approaches to identifying genes involved in complex human diseases. At the end of the course, participants should be able to identify the key components of a study team, and communicate effectively with specialists in various areas to design and execute a study. The course is in Miami Beach, FL. (Full Disclosure: I teach a section in this course.) Most of the course material from previous years is not available online, but my RNA-seq & methylation lectures are on Figshare.

UAB Short Course on Statistical Genetics and Genomics: soph.uab.edu/ssg/...
Focusing on the state-of-art methodology to analyze complex traits, this five-day course will offer an interactive program to enhance researchers' ability to understand & use statistical genetic methods, as well as implement & interpret sophisticated genetic analyses. Topics include GWAS Design/Analysis/Imputation/Interpretation; Non-Mendelian Disorders Analysis; Pharmacogenetics/Pharmacogenomics; ELSI; Rare Variants & Exome Sequencing; Whole Genome Prediction; Analysis of DNA Methylation Microarray Data; Variant Calling from NGS Data; RNAseq: Experimental Design and Data Analysis; Analysis of ChIP-seq Data; Statistical Methods for NGS Data; Discovering new drugs & diagnostics from 300 billion points of data. Video recording from the 2012 course are available online.

MBL Molecular Evolution Workshop: hermes.mbl.edu/education/...
One of the longest-running courses listed here (est. 1988), the Workshop on Molecular Evolution at Woods Hole presents a series of lectures, discussions, and bioinformatic exercises that span contemporary topics in molecular evolution. The course addresses phylogenetic analysis, population genetics, database and sequence matching, molecular evolution and development, and comparative genomics, using software packages including AWTY, BEAST, BEST, Clustal W/X, FASTA, FigTree, GARLI, MIGRATE, LAMARC, MAFFT, MP-EST, MrBayes, PAML, PAUP*, PHYLIP, STEM, STEM-hy, and SeaView. Some of the course materials can be found by digging around the course wiki.


Online Material:


Canadian Bioinformatics Workshops: bioinformatics.ca/workshops
(In person workshop described above). Course material from past workshops is freely available online, including both audio/video lectures and slideshows. Topics include microarray analysisRNA-seq analysis, genome rearrangements, copy number alteration, network/pathway analysis, genome visualization, gene function prediction, functional annotation, data analysis using R, statistics for metabolomics, andmuch more.

UC Davis Bioinformatics Training Program: training.bioinformatics.ucdavis.edu
(In person workshop described above). Every course's documentation is freely available online, even if you didn't take the course. Past topics include Galaxy, Bioinformatics for NGS, cloud computing, and RNA-seq.

MSU NGS Summer Course: bioinformatics.msu.edu/ngs-summer-course-2013
(In person workshop described above). Materials from previous courses are freely available online under a CC-by-SA license, which cover mapping, assembly, and analysis of short-read data for resequencing, ChIP-seq, and RNAseq.

EMBL-EBI Train Online: www.ebi.ac.uk/training/online
Train online provides free courses on Europe's most widely used data resources, created by experts at EMBL-EBI and collaborating institutes. Topics include Genes and GenomesGene Expression,Interactions, Pathways, and Networks, and others. Of particular interest may be the Practical Course on Analysis of High-Throughput Sequencing Data, which covers Bioconductor packages for short read analysis, ChIP-Seq, RNA-seq, and allele-specific expression & eQTLs.

UC Riverside Bioinformatics Manuals: manuals.bioinformatics.ucr.edu
This is an excellent collection of manuals and code snippets. Topics include Programming in RR+BioconductorSequence Analysis with R and BioconductorNGS analysis with Galaxy and IGV, basicLinux skills, and others.

Software Carpentry: software-carpentry.org
Software Carpentry helps researchers be more productive by teaching them basic computing skills. We recently ran a 2-day Software Carpentry Bootcamp here at UVA. Check out the online lectures for some introductory material on Unix, Python, Version Control, Databases, Automation, and many other topics.

Coursera: coursera.org/courses
Coursera partners with top universities to offer courses online for anytone to take, for free. Courses are usually 4-6 weeks, and consist of video lectures, quizzes, assignments, and exams. Joining a course gives you access to the course's forum where you can interact with the instructor and other participants. Relevant courses include Data AnalysisComputing for Data Analysis using R, and Bioinformatics Algorithms, among others. You can also view all of Jeff Leek's Data Analysis lectures on Youtube.
Rosalind: http://rosalind.info
Quite different from the others listed here, Rosalind is a platform for learning bioinformatics through gaming-like problem solving. Visit the Python Village to learn the basics of Python. Arm yourself at theBioinformatics Armory, equipping yourself with existing ready-to-use bioinformatics software tools. Or storm the Bioinformatics Stronghold, implementing your own algorithms for computational mass spectrometry, alignment, dynamic programming, genome assembly, genome rearrangements, phylogeny, probability, string algorithms and others.


Other Resources:


  • Titus Brown's list bioinformatics courses: Includes a few others not listed here (also see the comments).
  • GMOD Training and Outreach: GMOD is the Generic Model Organism Database project, a collection of open source software tools for creating and managing genome-scale biological databases. This page links out to tutorials on GMOD Components such as Apollo, BioMart, Galaxy, GBrowse, MAKER, and others.
  • Seqanswers.com: A discussion forum for anything related to Bioinformatics, including Q&A, paper discussions, new software announcements, protocols, and more.
  • Biostars.org: Similar to SEQanswers, but more strictly a Q&A site.
  • BioConductor Mailing list: A very active mailing list for getting help with Bioconductor packages. Make sure you do some Google searching yourself first before posting to this list.
  • Bioconductor Events: List of upcoming and prior Bioconductor training and events worldwide.
  • Learn Galaxy: Screencasts and tutorials for learning to use Galaxy.
  • Galaxy Event Horizon: Worldwide Galaxy-related events (workshops, training, user meetings) are listed here.
  • Galaxy RNA-Seq Exercise: Run through a small RNA-seq study from start to finish using Galaxy.
  • Rafael Irizarry's Youtube Channel: Several statistics and bioinformatics video lectures.
  • PLoS Comp Bio Online Bioinformatics Curriculum: A perspective paper by David B Searls outlining a series of free online learning initiatives for beginning to advanced training in biology, biochemistry, genetics, computational biology, genomics, math, statistics, computer science, programming, web development, databases, parallel computing, image processing, AI, NLP, and more.
  • Getting Genetics Done: Shameless plug – I write a blog highlighting literature of interest, new tools, and occasionally tutorials in genetics, statistics, and bioinformatics. I recently wrote this post about how to stay current in bioinformatics & genomics.
Creative Commons License
Getting Genetics Done by Stephen Turner is licensed under a Creative Commons Attribution-NonCommercial 3.0 Unported License.