Friday, May 22, 2026

Repost: ctrlvee: Extract external R code and insert inline

Reposted from the original at https://blog.stephenturner.us/p/ctrlvee-extract-external-r-code-insert-inline-positron-rstudio-addin. 

Ever find yourself looking through a pkgdown page or a Quarto book, copying and pasting code chunks from your browser into your IDE? I do, and it’s a minor annoyance.1

My friend and colleague VP Nagraj published a new R package called ctrlvee that makes this a lot easier.

It does one thing. Put your cursor anywhere in an R script in Positron or RStudio, call the add-in, provide a URL, and a few milliseconds later you’ll have all the code from that page in your editor, separated by chunk boundaries (along with some metadata and a note to check the license!).

The package README provides a demonstration using the “Data Validation and QA” chapter of my Data Science Team Training book (dstt.stephenturner.us).

  1. Install the package: install.packages("ctrlvee")

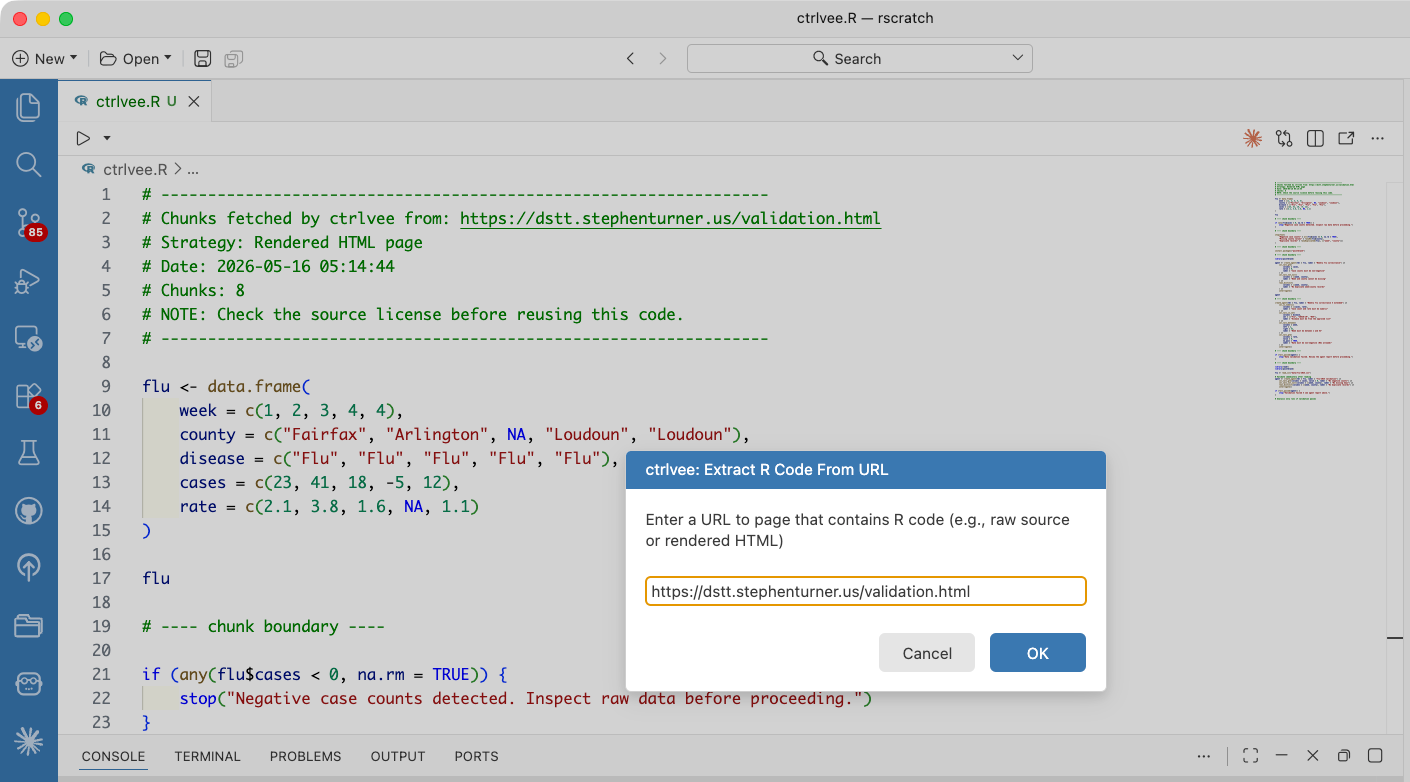
  2. Run the add-in. In Positron you’ll open the command palette, search for Run RStudio Addin, then extract external R code and insert inline. You’ll get a modal asking you for a URL.

  3. Paste one in. E.g., https://dstt.stephenturner.us/validation.html

  4. The R code from the website appears in your editor 🚀

Here’s a demo.

Here’s what the extracted/inserted code looks like, from this source.

# -----------------------------------------------------------------
# Chunks fetched by ctrlvee from: https://dstt.stephenturner.us/validation.html
# Strategy: Rendered HTML page
# Date: 2026-05-16 05:14:44
# Chunks: 8
# NOTE: Check the source license before reusing this code.
# -----------------------------------------------------------------

flu <- data.frame(
    week = c(1, 2, 3, 4, 4),
    county = c("Fairfax", "Arlington", NA, "Loudoun", "Loudoun"),
    disease = c("Flu", "Flu", "Flu", "Flu", "Flu"),
    cases = c(23, 41, 18, -5, 12),
    rate = c(2.1, 3.8, 1.6, NA, 1.1)
)

flu

# ---- chunk boundary ----

if (any(flu$cases < 0, na.rm = TRUE)) {
    stop("Negative case counts detected. Inspect raw data before proceeding.")
}

# ---- chunk boundary ----

stopifnot(
    "Negative case counts" = all(flu$cases >= 0, na.rm = TRUE),
    "Missing county values" = !anyNA(flu$county),
    "Duplicate records" = !anyDuplicated(flu[, c("week", "county")])
)

# ---- chunk boundary ----

install.packages("pointblank")

# ---- chunk boundary ----

library(pointblank)

agent <- create_agent(tbl = flu, label = "Weekly flu surveillance") |>
    col_vals_gte(
        columns = cases,
        value = 0,
        label = "Case counts must be non-negative"
    ) |>
    col_vals_not_null(
        columns = c(week, county),
        label = "Week and county cannot be missing"
    ) |>
    rows_distinct(
        columns = c(week, county),
        label = "No duplicate week/county records"
    ) |>
    interrogate()

agent

# ---- chunk boundary ----

create_agent(tbl = flu, label = "Weekly flu surveillance — extended") |>
    col_is_numeric(
        columns = c(cases, rate),
        label = "Case count and rate must be numeric"
    ) |>
    col_vals_in_set(
        columns = disease,
        set = c("Flu", "COVID-19", "RSV"),
        label = "Disease must be from the approved list"
    ) |>
    col_vals_between(
        columns = week,
        left = 1,
        right = 52,
        label = "Week must be between 1 and 52"
    ) |>
    col_vals_gte(
        columns = rate,
        value = 0,
        na_pass = TRUE,
        label = "Rate must be non-negative (NAs allowed)"
    ) |>
    interrogate()

# ---- chunk boundary ----

if (!all_passed(agent)) {
    stop("Data validation failed. Review the agent report before proceeding.")
}

# ---- chunk boundary ----

library(readr)
library(pointblank)

flu <- read_csv("data/flu-2024.csv")

# Validate immediately after reading
agent <- create_agent(tbl = flu, label = "flu-2024 validation") |>
    col_vals_gte(columns = cases, value = 0, label = "No negative counts") |>
    col_vals_not_null(columns = c(week, county), label = "No missing keys") |>
    rows_distinct(columns = c(week, county), label = "No duplicate records") |>
    interrogate()

if (!all_passed(agent)) {
    stop("Validation failed — see agent report above.")
}


Wednesday, February 4, 2026

Repost: OpenAI Codex App: Vibe-updating my old qqman R package to ggplot2 with plan+execute.

Reposted from the original at https://blog.stephenturner.us/p/openai-codex-app-qqman.

Earlier this week I reposted a Bluesky post from Ethan Mollick. I’m on the same page here — there are problems for sure, but these tools have irreversibly changed the practice of software development (and IMHO, for the better on balance).

Claude Code has gotten everyone excited recently (including me), even going so far as to make it into the popular press (see the Atlantic article on CC). Codex has been around for a while, but this looks like OpenAI’s attempt to challenge CC’s position.

The new Codex desktop app

This week OpenAI launched a dedicated Codex desktop app positioned as a focused UI for running multiple agents in parallel, keeping changes isolated via built-in worktrees, and extending behavior with skills and scheduled automations. Like the demo I highlighted in my previous post on Claude Code, Codex uses worktrees to isolate tasks/PRs as primitives for conflict resolution, has a plan mode (/plan) to force upfront decomposition and questions, can use skills as reusable bundles that can connect to external services, and has automations for recurring background jobs.

Download it at openai.com/codex. It’s free to use for some unspecified time. Or works with your Plus/Enterprise/Edu/whatever account.

Demo: updating qqman to use ggplot2

My most highly cited paper is about some R code I wrote 15 years ago, and later turned into a package, for creating Manhattan Plots from GWAS data. The paper in JOSS has been cited ~1000 times, and the preprint another ~2100 times.

Turner, S. D. (2018). qqman: an R package for visualizing GWAS results using Q-Q and manhattan plots. Journal of Open Source Software, 3(25), 731. https://doi.org/10.21105/joss.00731.

I wrote the original code using ggplot2, then refactored everything to use base R, because at the time, at least with how I wrote the package, plotting millions of points with ggplot2 as agonizingly slow.

I’ve gotten lots of feature requests for qqman, and I don’t have time to respond to them unfortunately. Many of these feature requests would be easy to implement if the package did in fact use ggplot2, since it’s been so long since I’ve done anything in base R that I’ve forgotten how to do pretty much anything.

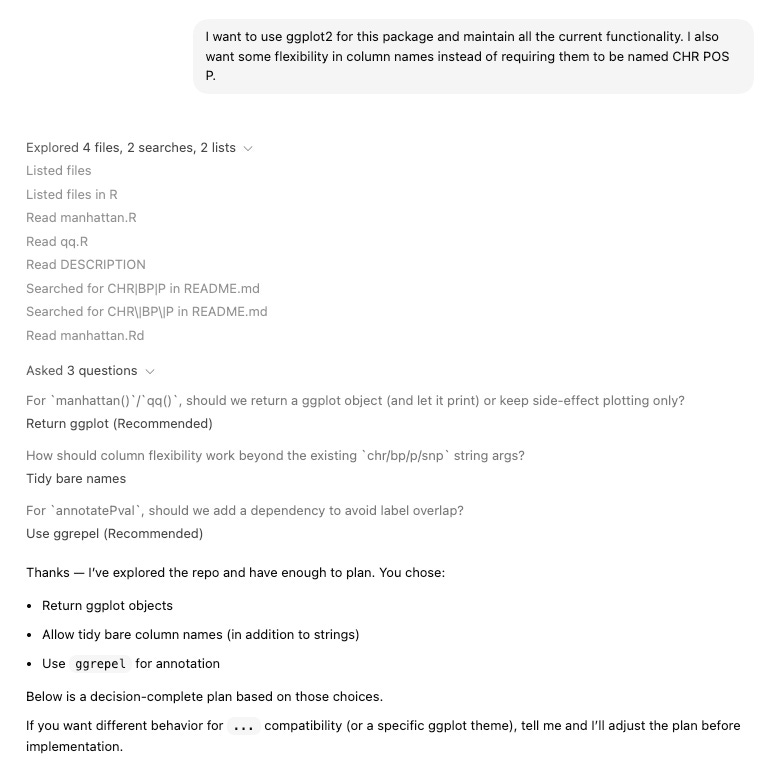
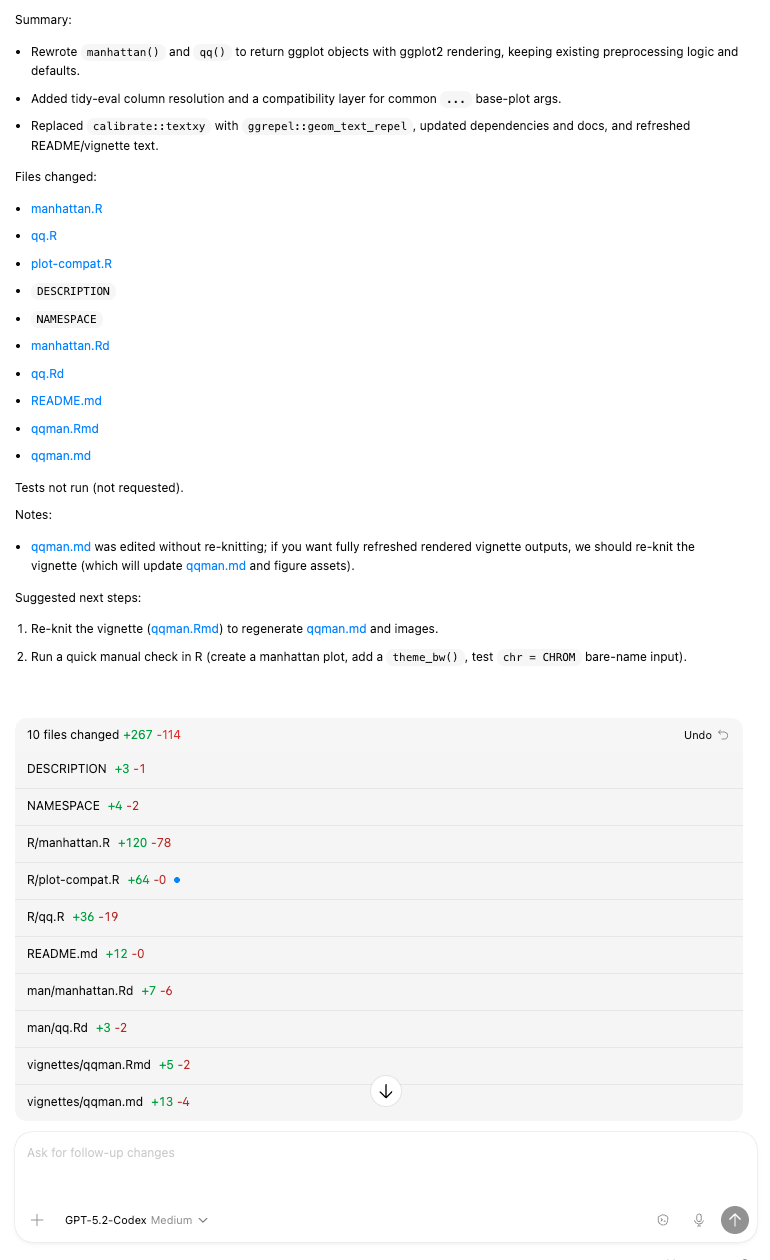
So I fired up the Codex app, put it into “plan” mode, and asked for help. Along the way it asks me questions about my preferences.

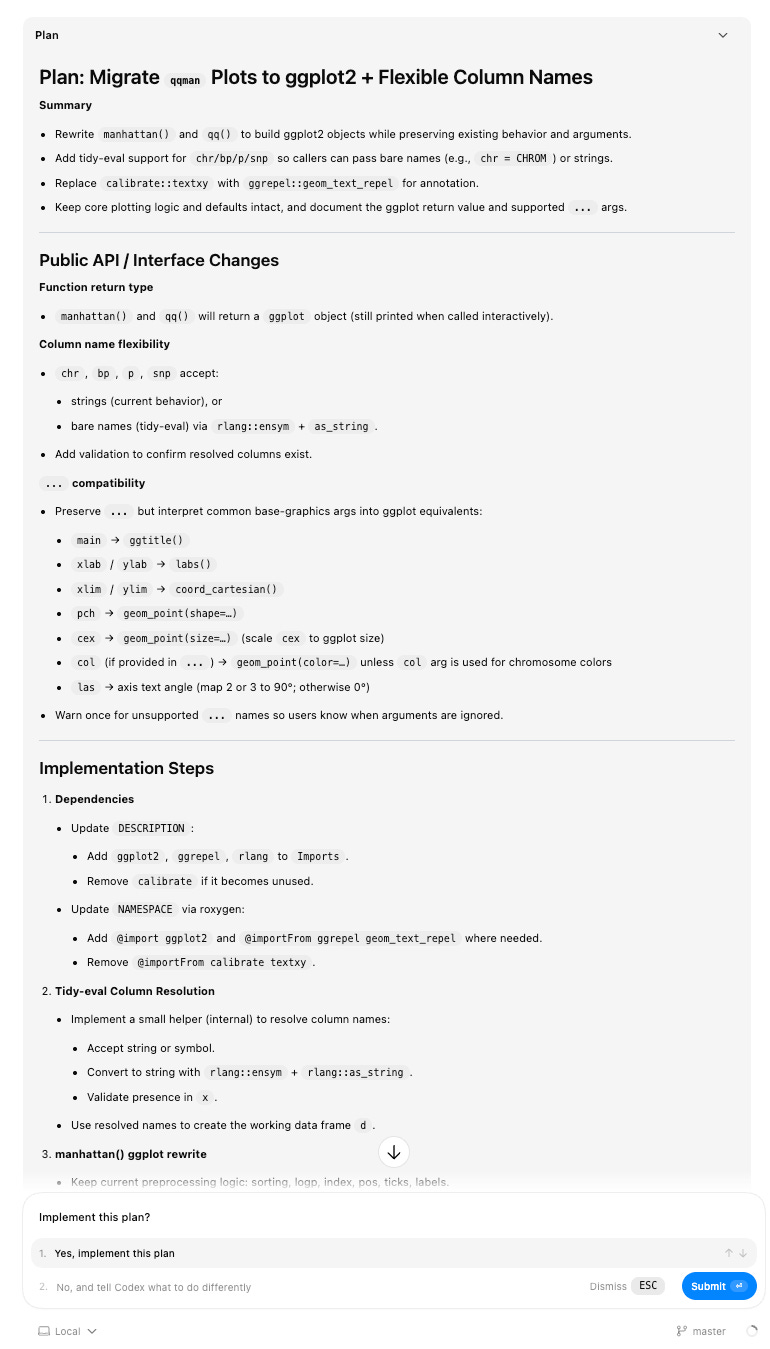
Here’s a screenshot of the plan (truncated).

#YOLO, implement the plan.

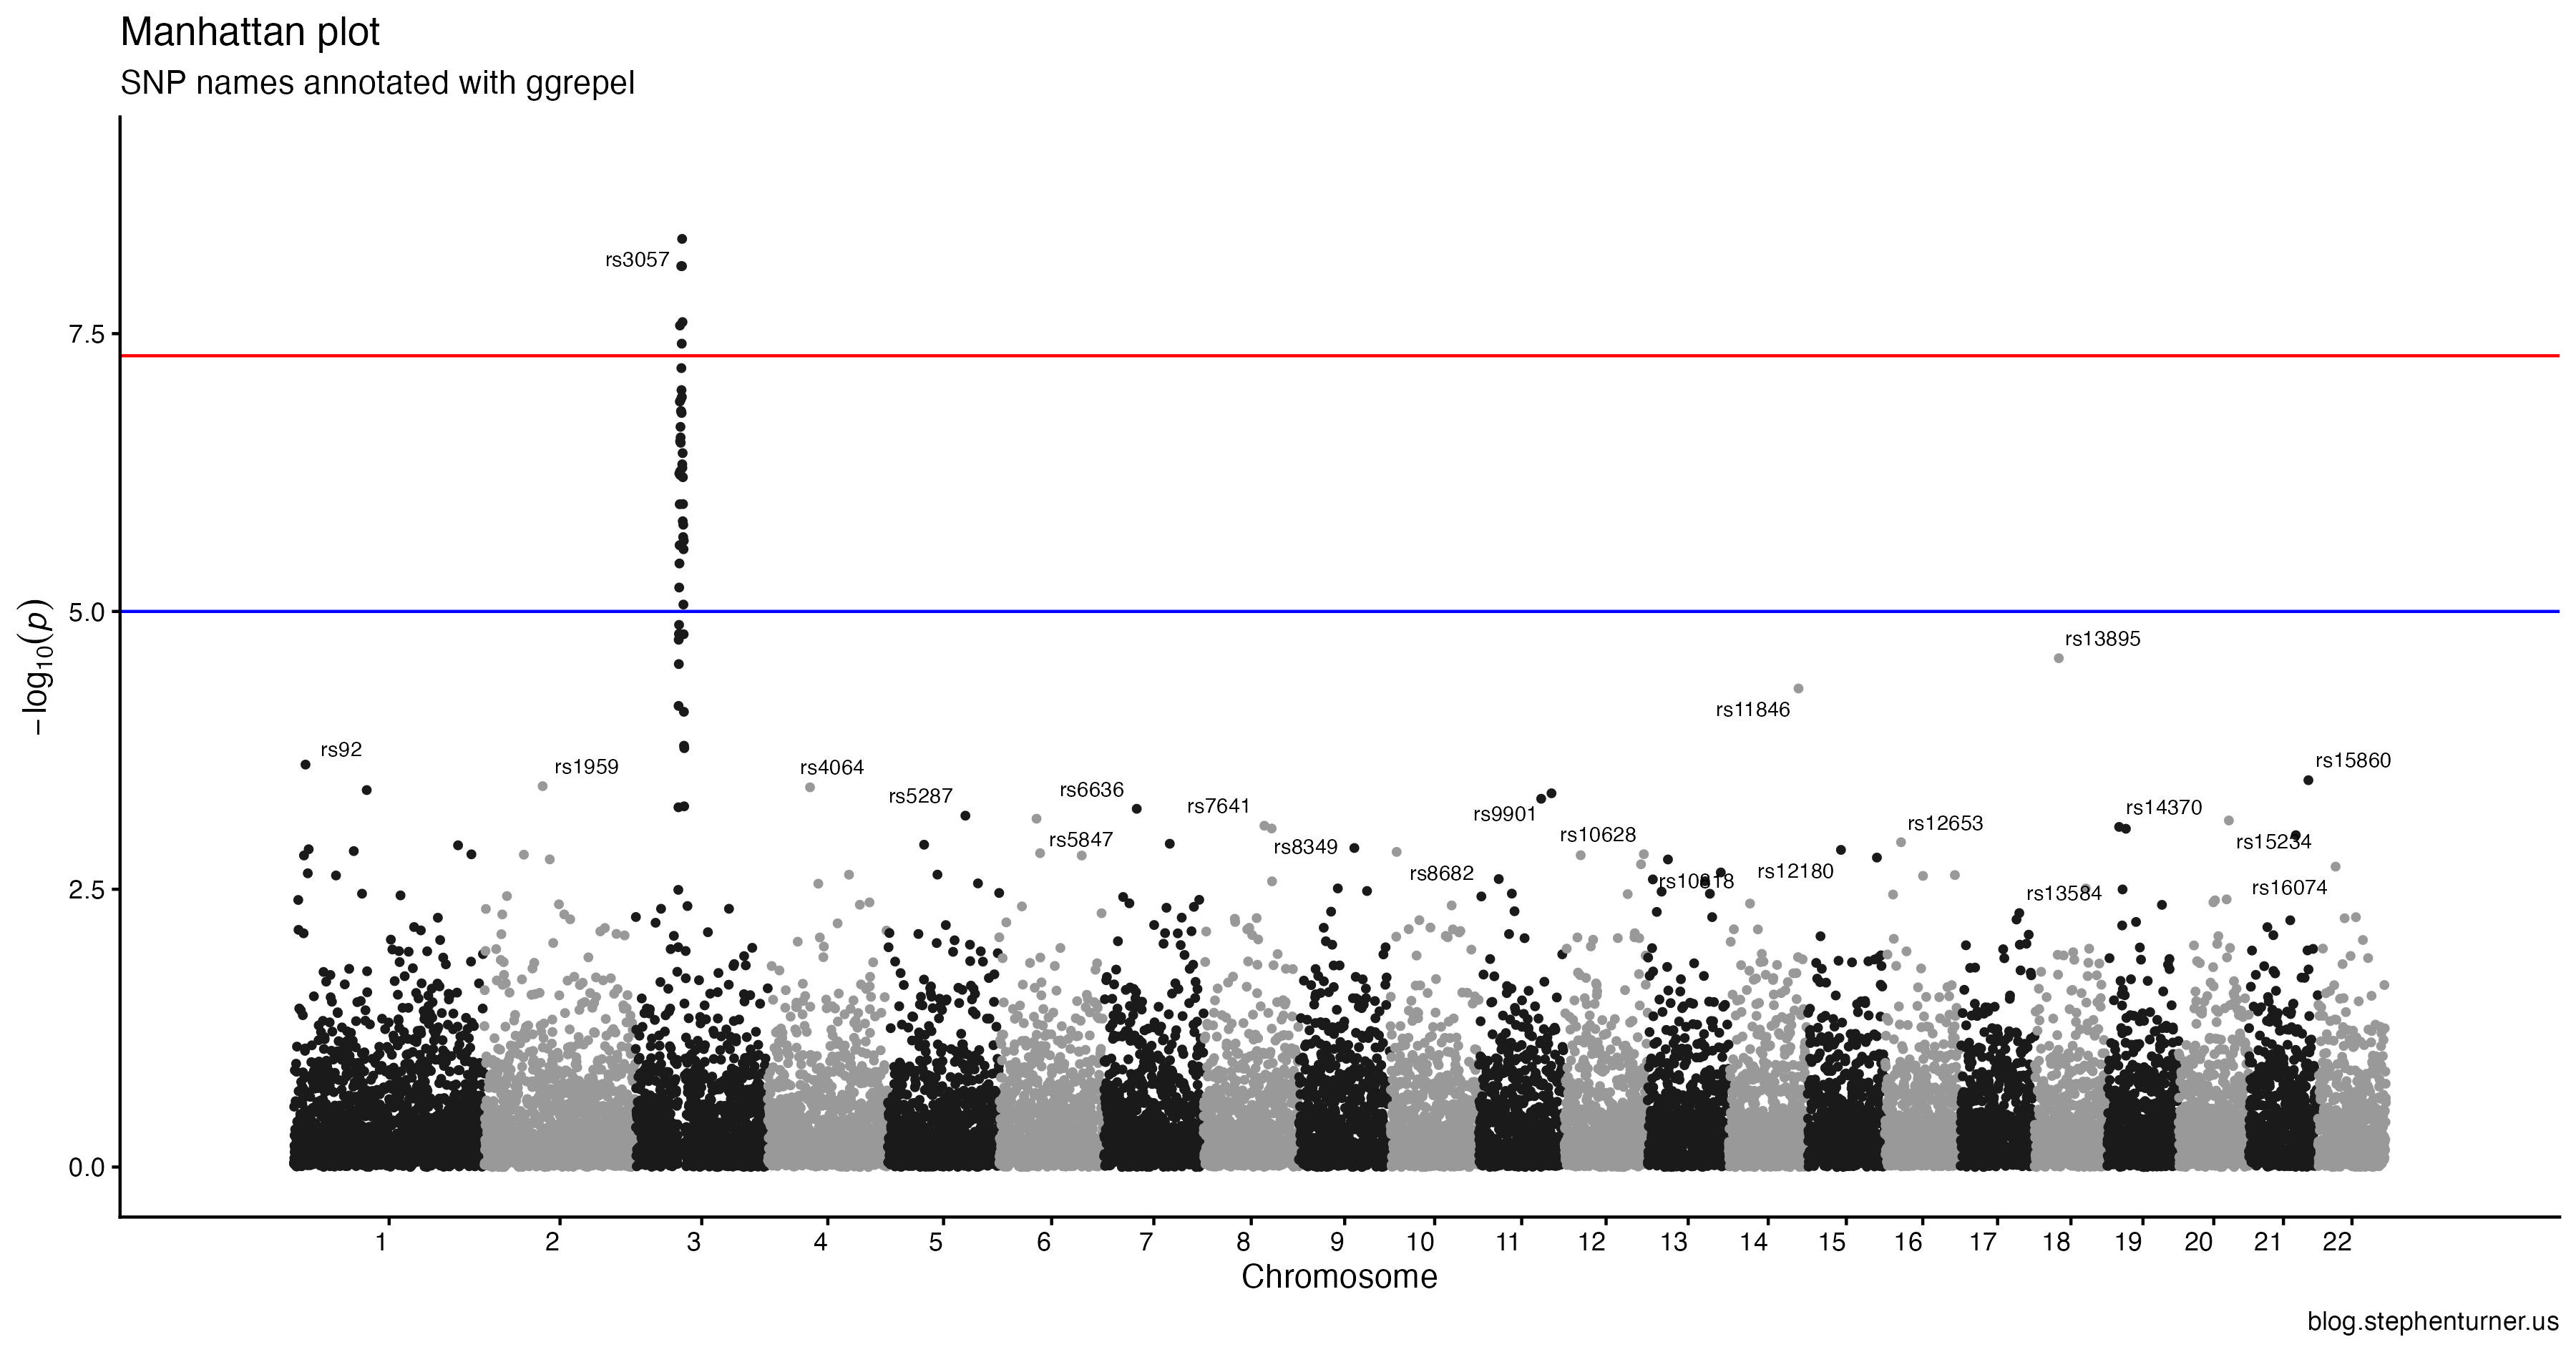
When I rebuilt the package, there were a few of those “no visible global binding for global variable…” notes that I had to fix, but otherwise everything worked. Everything now uses ggplot2. The function returns a ggplot object. Column names are no longer as strict. It’s fast. It uses ggrepel to label points so that they don’t overlap. Documentation was updated. The README was updated. The vignettes were updated. It went off and did this in about 5 minutes.

Here’s one of the plots that comes out of this.

I’m not going to update the package, because I still don’t have time to maintain it or respond to feature requests. But that shouldn’t stop you if there’s something you want to do with qqman or any other open-source R/Python package that the package doesn’t currently do.